Configuring the Score Card

Default Configuration
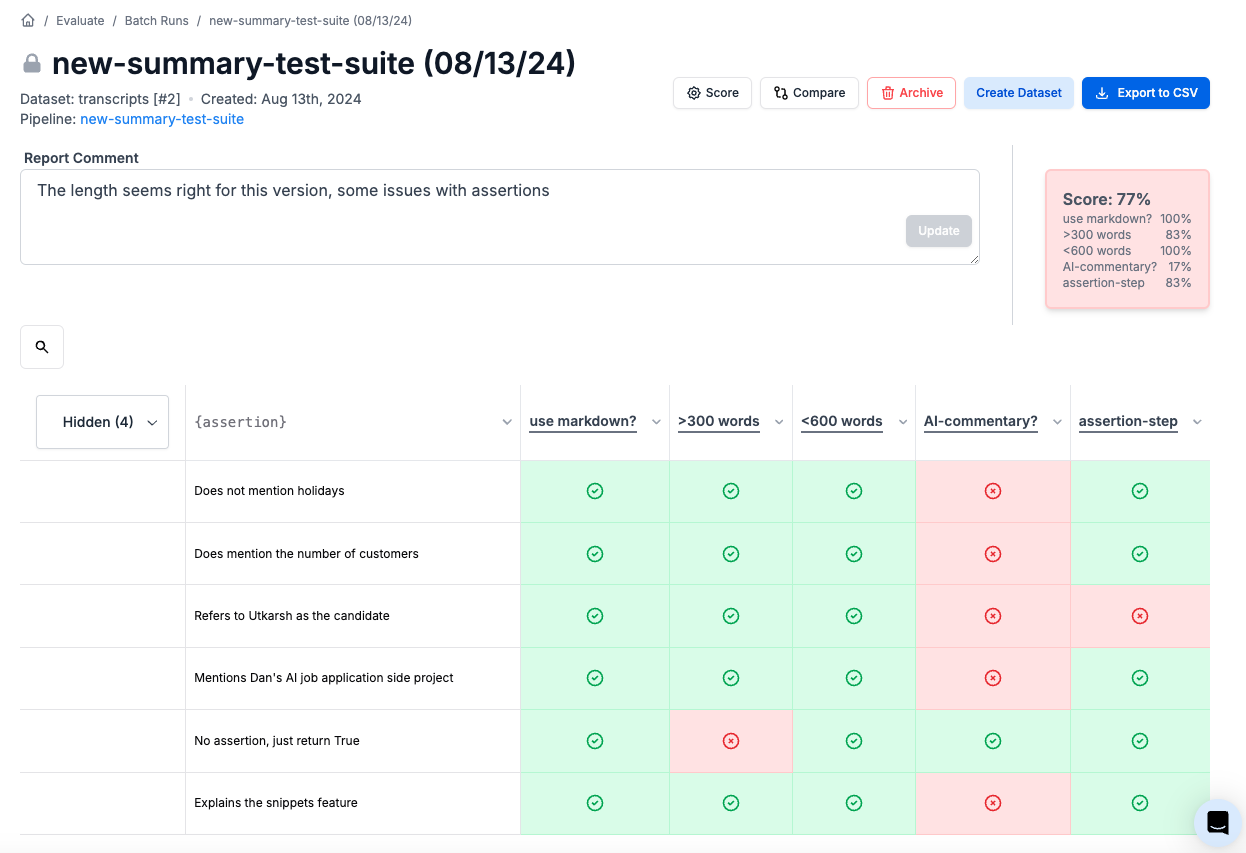
By default, the score is calculated based on the last column in your evaluation results:- If the last column contains Booleans, the score will be the percentage of
truevalues. - If the last column contains numbers, the score will be the average of those numbers.
Custom Column Selection
You can customize which columns are included in the score card calculation. When setting up your evaluation pipeline, click the “Score card” button to configure the score card. Here, you can add specific columns to be included in the score calculation:- If you add multiple numeric columns, the total score will be the average of the averages for each selected column.
- If you add multiple Boolean columns, the total score will be the average of the
truepercentages for each selected column. - Columns that do not contain numbers or Booleans will not be included in the score calculation.
Custom Scoring Logic
For more advanced scoring needs, you can provide your own custom scoring logic using Python or JavaScript code. The code execution environment is the same as the one used for the code execution evaluation column type (learn more). This custom scoring logic can be used to generate a single score number or a drill-down matrix.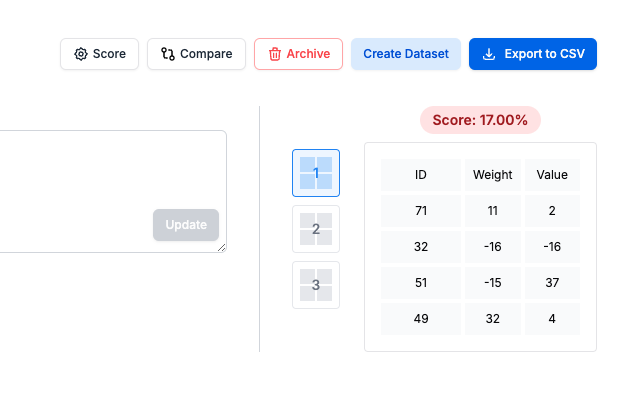
score(required): A number representing the overall score. This is mandatory.score_matrix(optional): A list of lists of lists, representing one or more matrices of drilled-down scores. Each cell in these matrices can be a raw value or an object with metadata.sub_scores(optional): A dictionary mapping label names to numeric values. Sub-scores appear in the score card’s drill-down breakdown panel, letting you break the overall score into named components (e.g.,{"correctness": 0.9, "relevance": 0.8}).
Score Matrix Cell Format
Each cell in thescore_matrix can be either:
- A raw value (string or number), or
- An object with the following properties:
value: The actual value of the cell, which can be a string or number.positive_metric: (Optional) A boolean indicating whether an increase in this value is considered positive (true). If absent, we default to true.
- Simple value:
42 - Object with metadata:
{"value": 42, "positive_metric": true}
positive_metric property can be used to indicate how changes in the value should be interpreted when comparing evaluations. This is particularly useful for automated reporting and analysis tools.
Adding Titles to Score Matrices
To add titles to your score matrices, simply add an extra field to the first row of the matrix and it will automatically be interpreted as the primary title. For example, if you have a matrix like:Code example
Thedata variable will be available in your scoring code, which is a list containing a dictionary for each row in the evaluation results. The keys in each dictionary correspond to the column names, and the values are the corresponding cell values.
For example:
Python
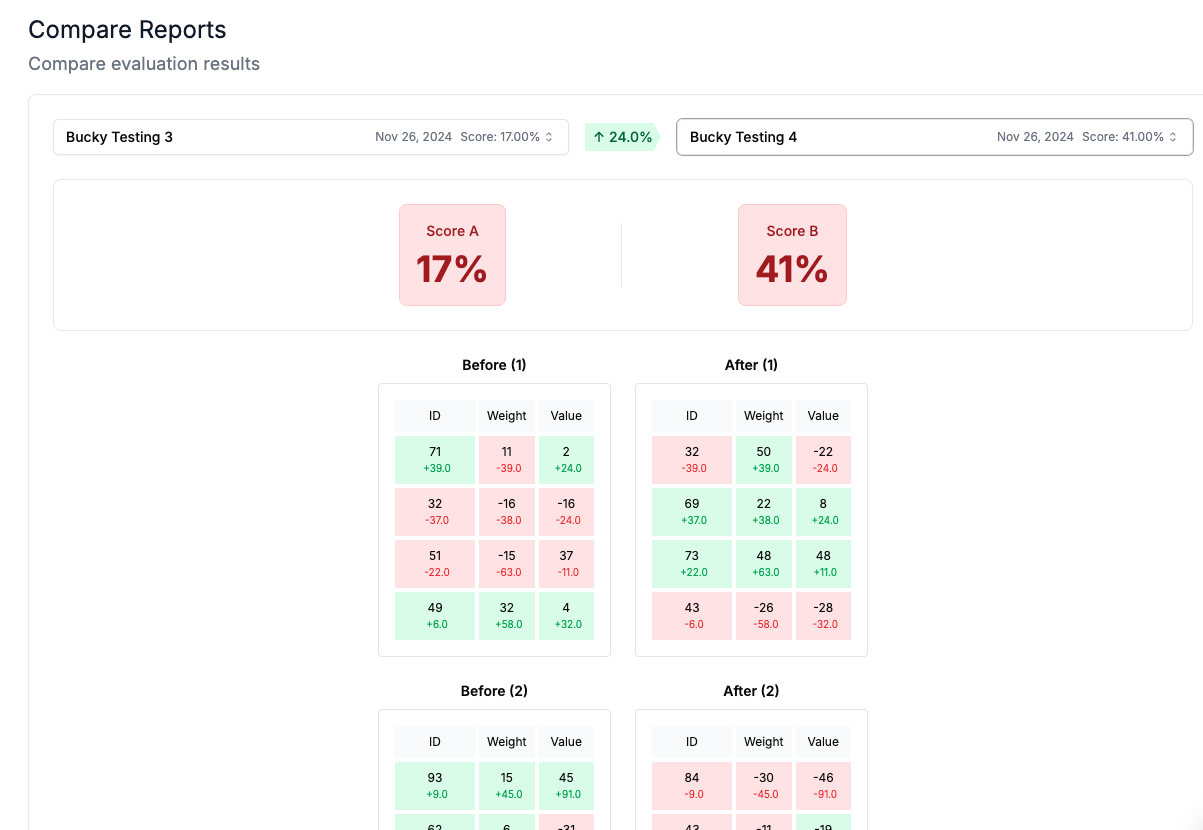
Comparing Evaluation Reports
You can compare two evaluation reports to see how scores and other metrics have changed between runs. Simply click the “Compare” button and select the evaluation reports you want to compare. The score card and any score matrices will be displayed side-by-side for easy comparison of your prompt’s performance over time.