Metrics
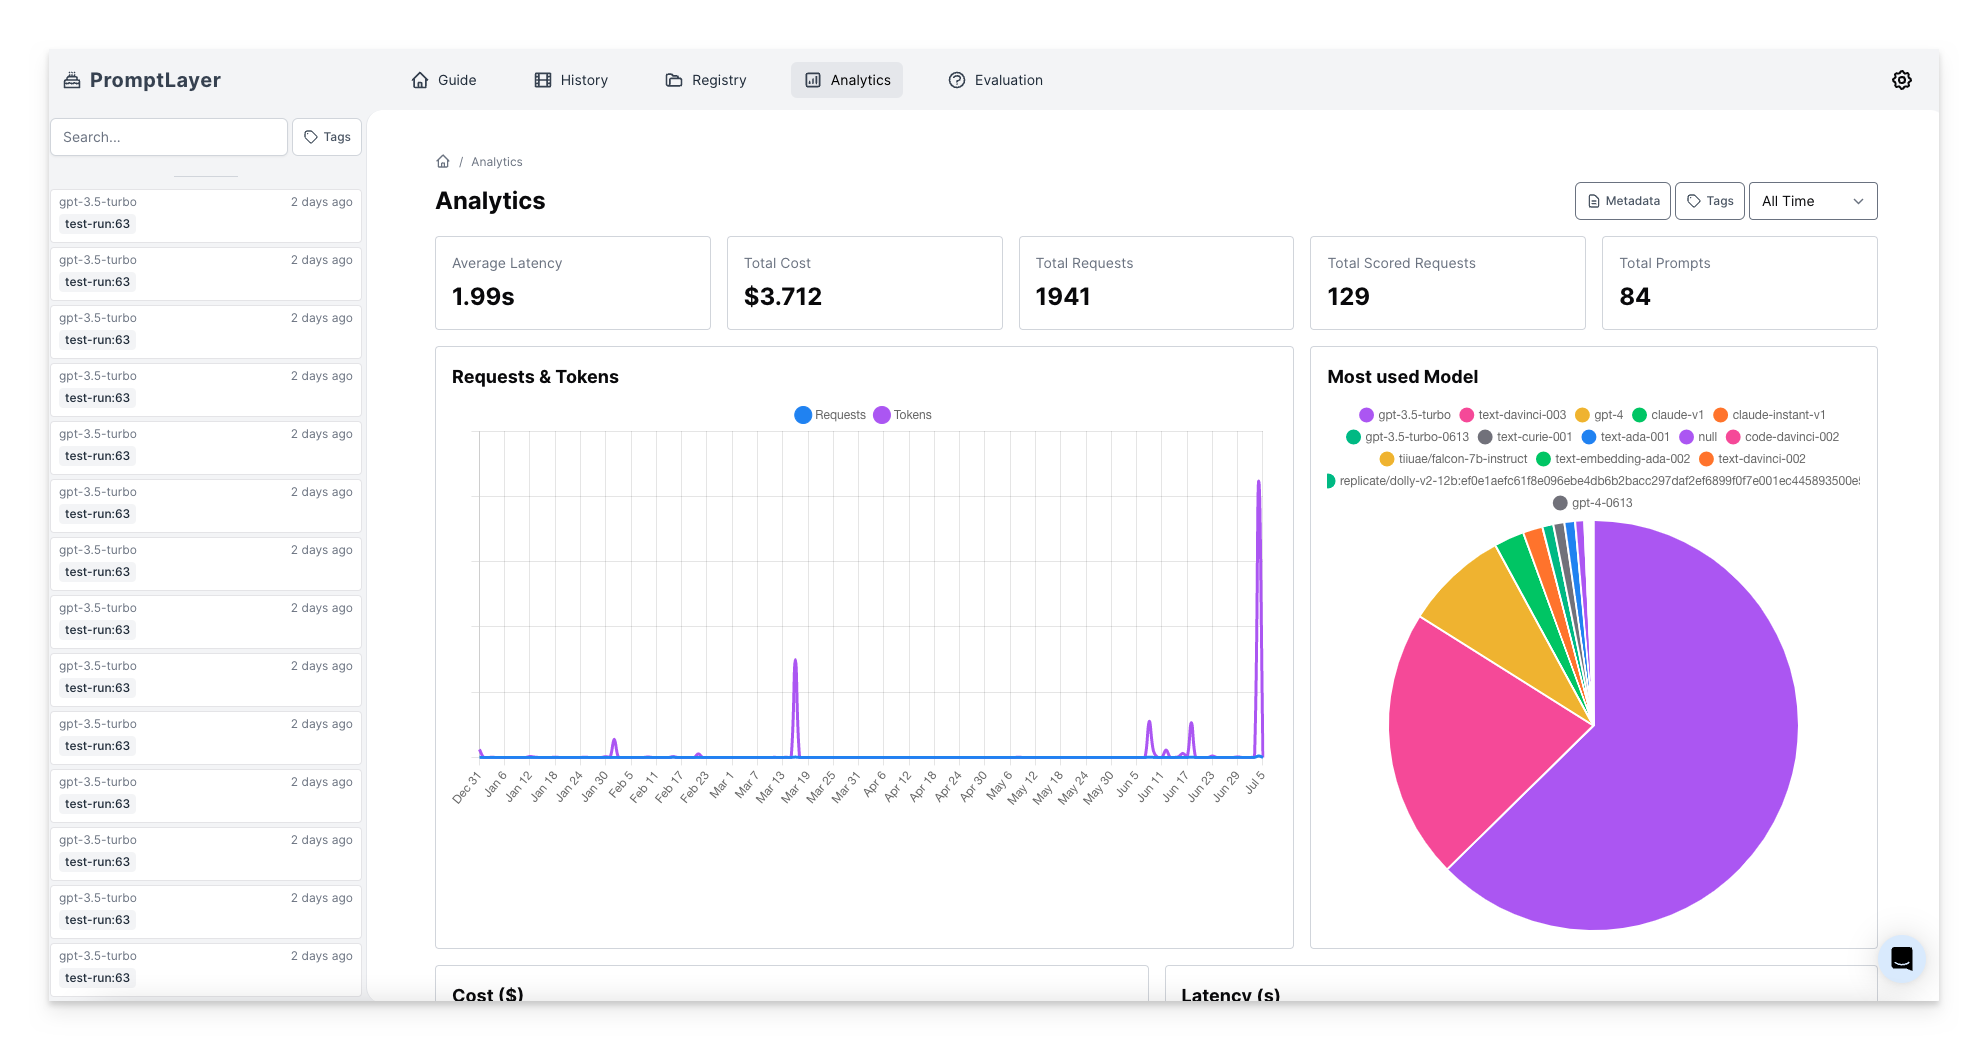
Here you can find key performance indicators to assess your application’s performance and track its usage. Metrics include: average latency, total cost, and total requests. These metrics provide valuable information on response time, financial impact, and usage volume.Analyzing Usage Patterns
Understanding usage patterns is crucial for optimizing your application and improving user experience. Analyzing usage patterns involves exploring prompt registry states, model distributions, tokens and requests over time, latency and cost analytics, and prompt template overall costs. These features provide insights into how prompts, models, and resources are utilized, helping you make informed decisions to enhance your application’s performance.Ask Wrangler for request-data insights
If you want a quick read on request usage, open the Wrangler assistant in the bottom-right of the screen and ask directly (for example: “Create a graph of most used prompts over the past week”). Wrangler can probe request analytics first, confirm which prompts have traffic, and then build a chart view from that data.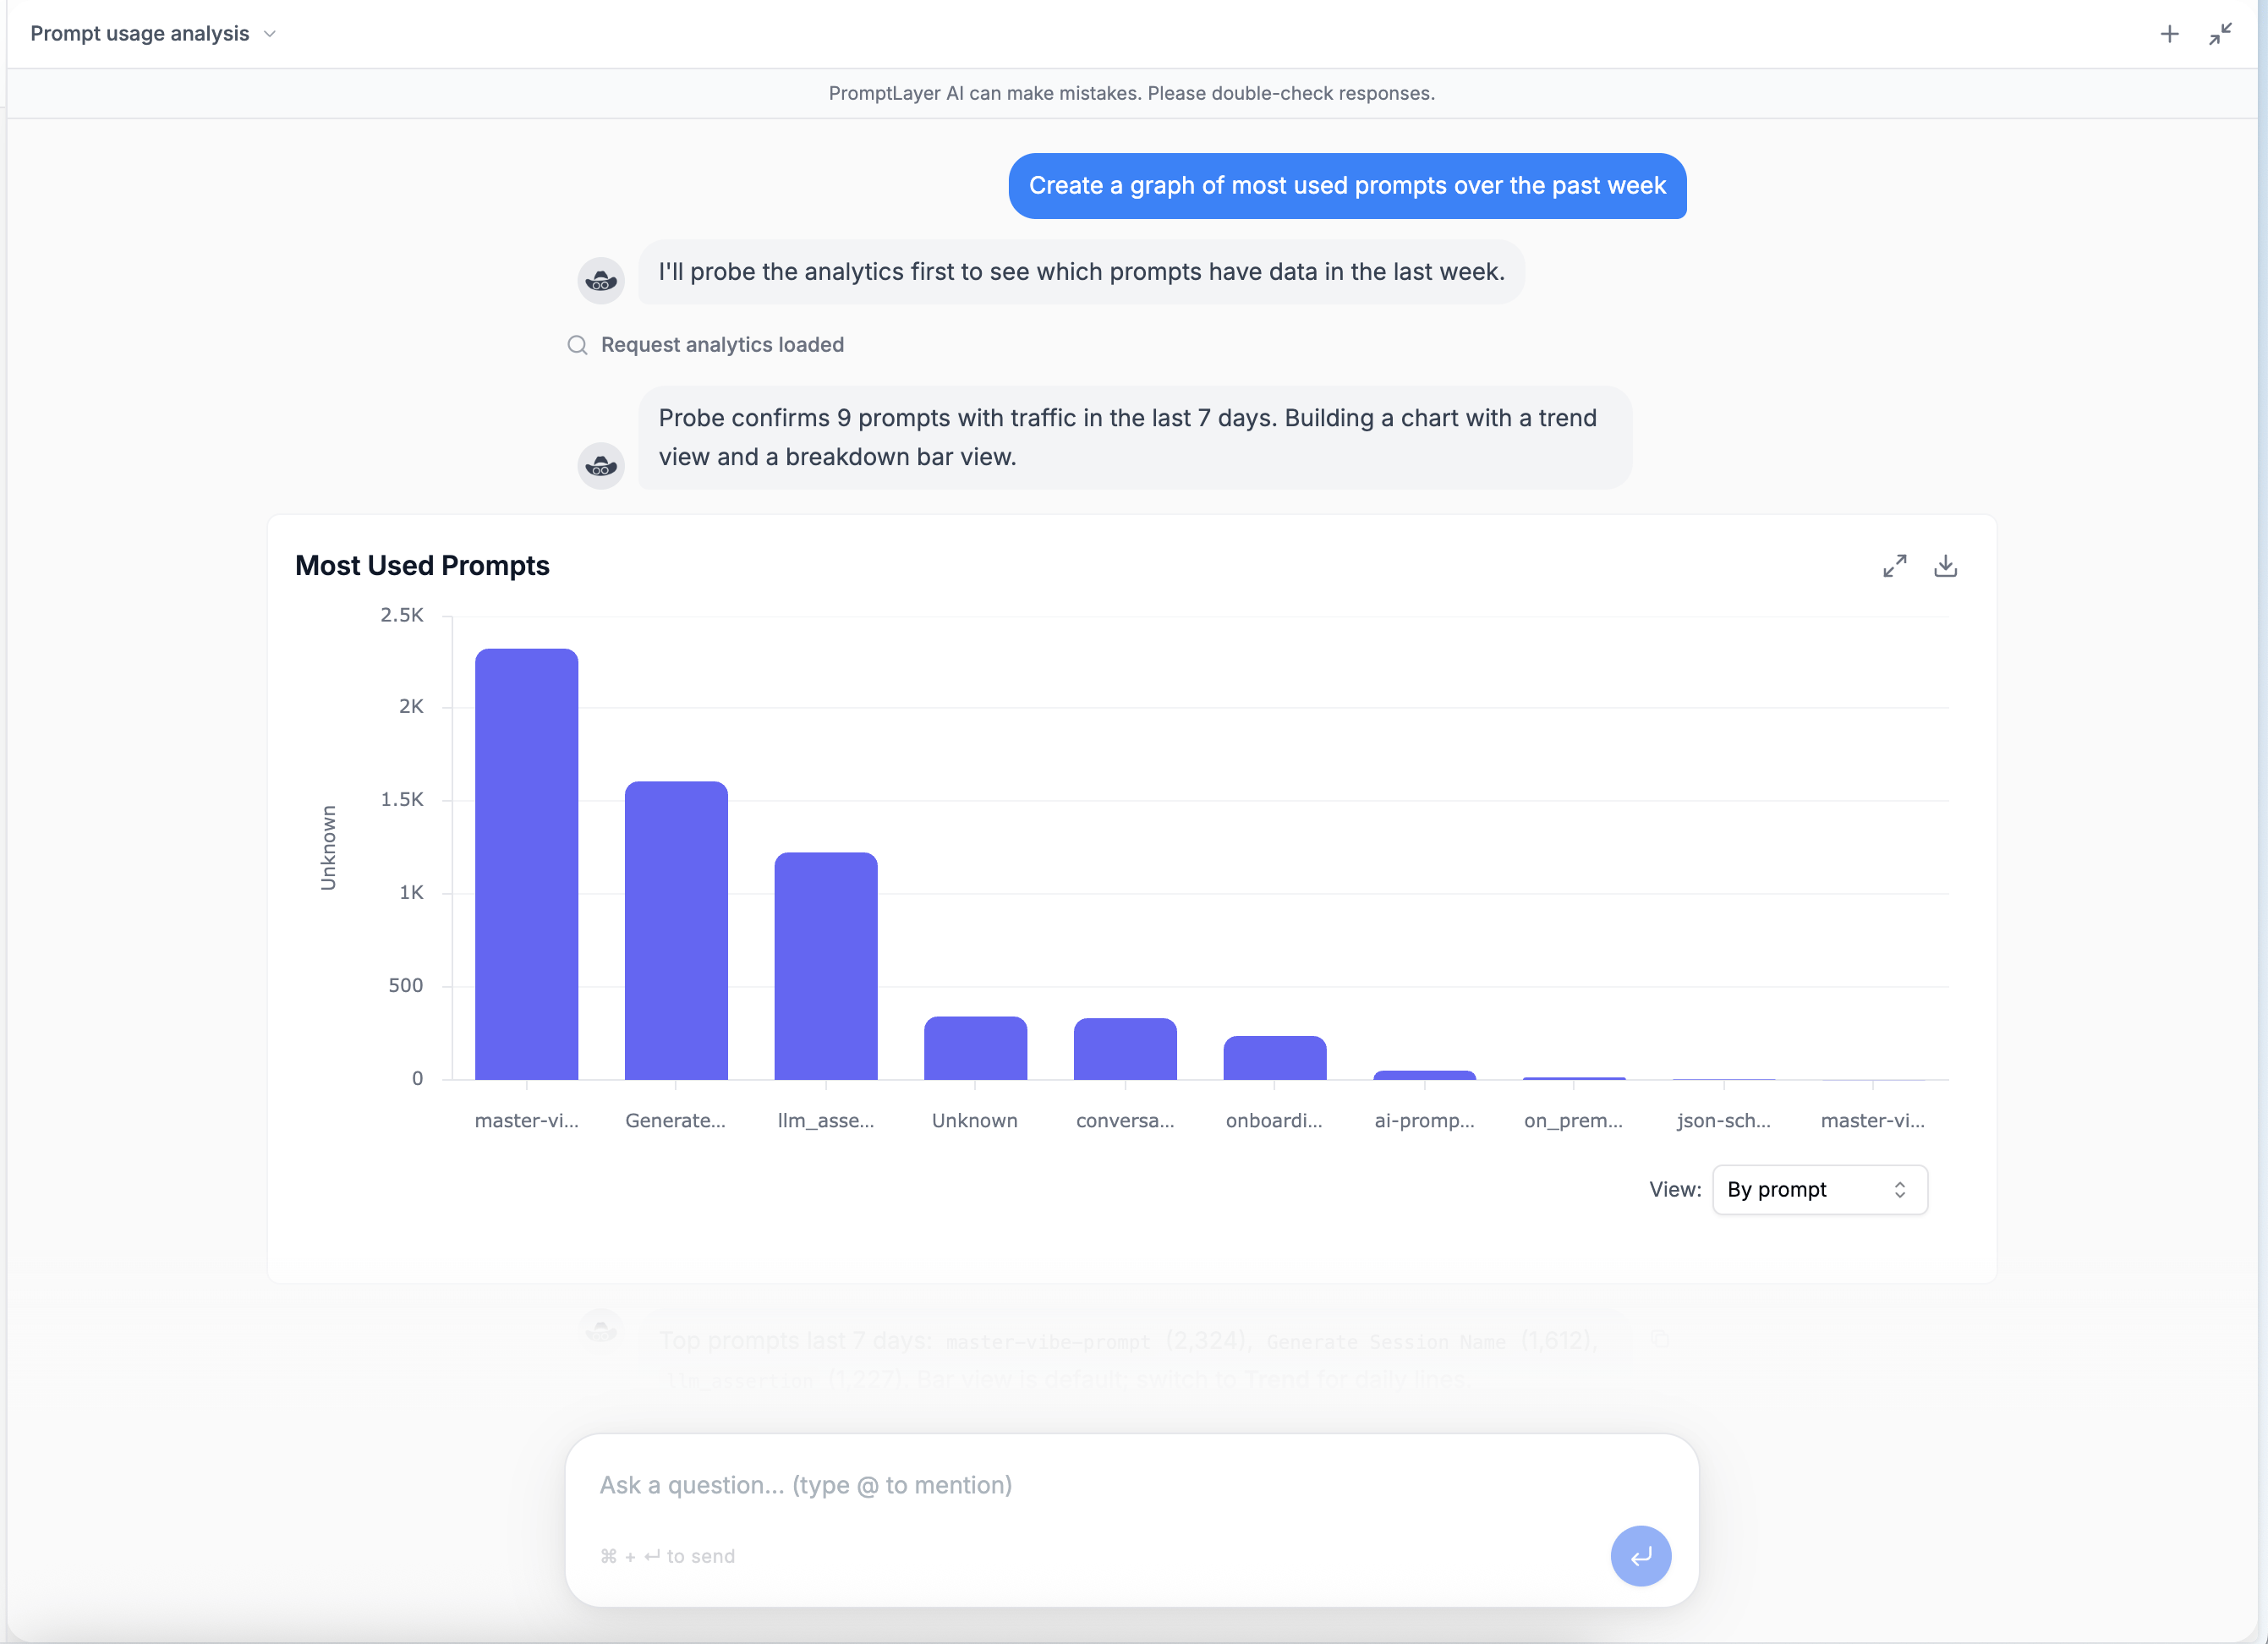
Filtering and Organization
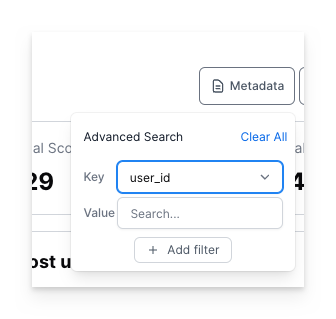
To streamline your analysis, the analytics page offers filtering options based on metadata and tags.Filtering by Metadata