Overview
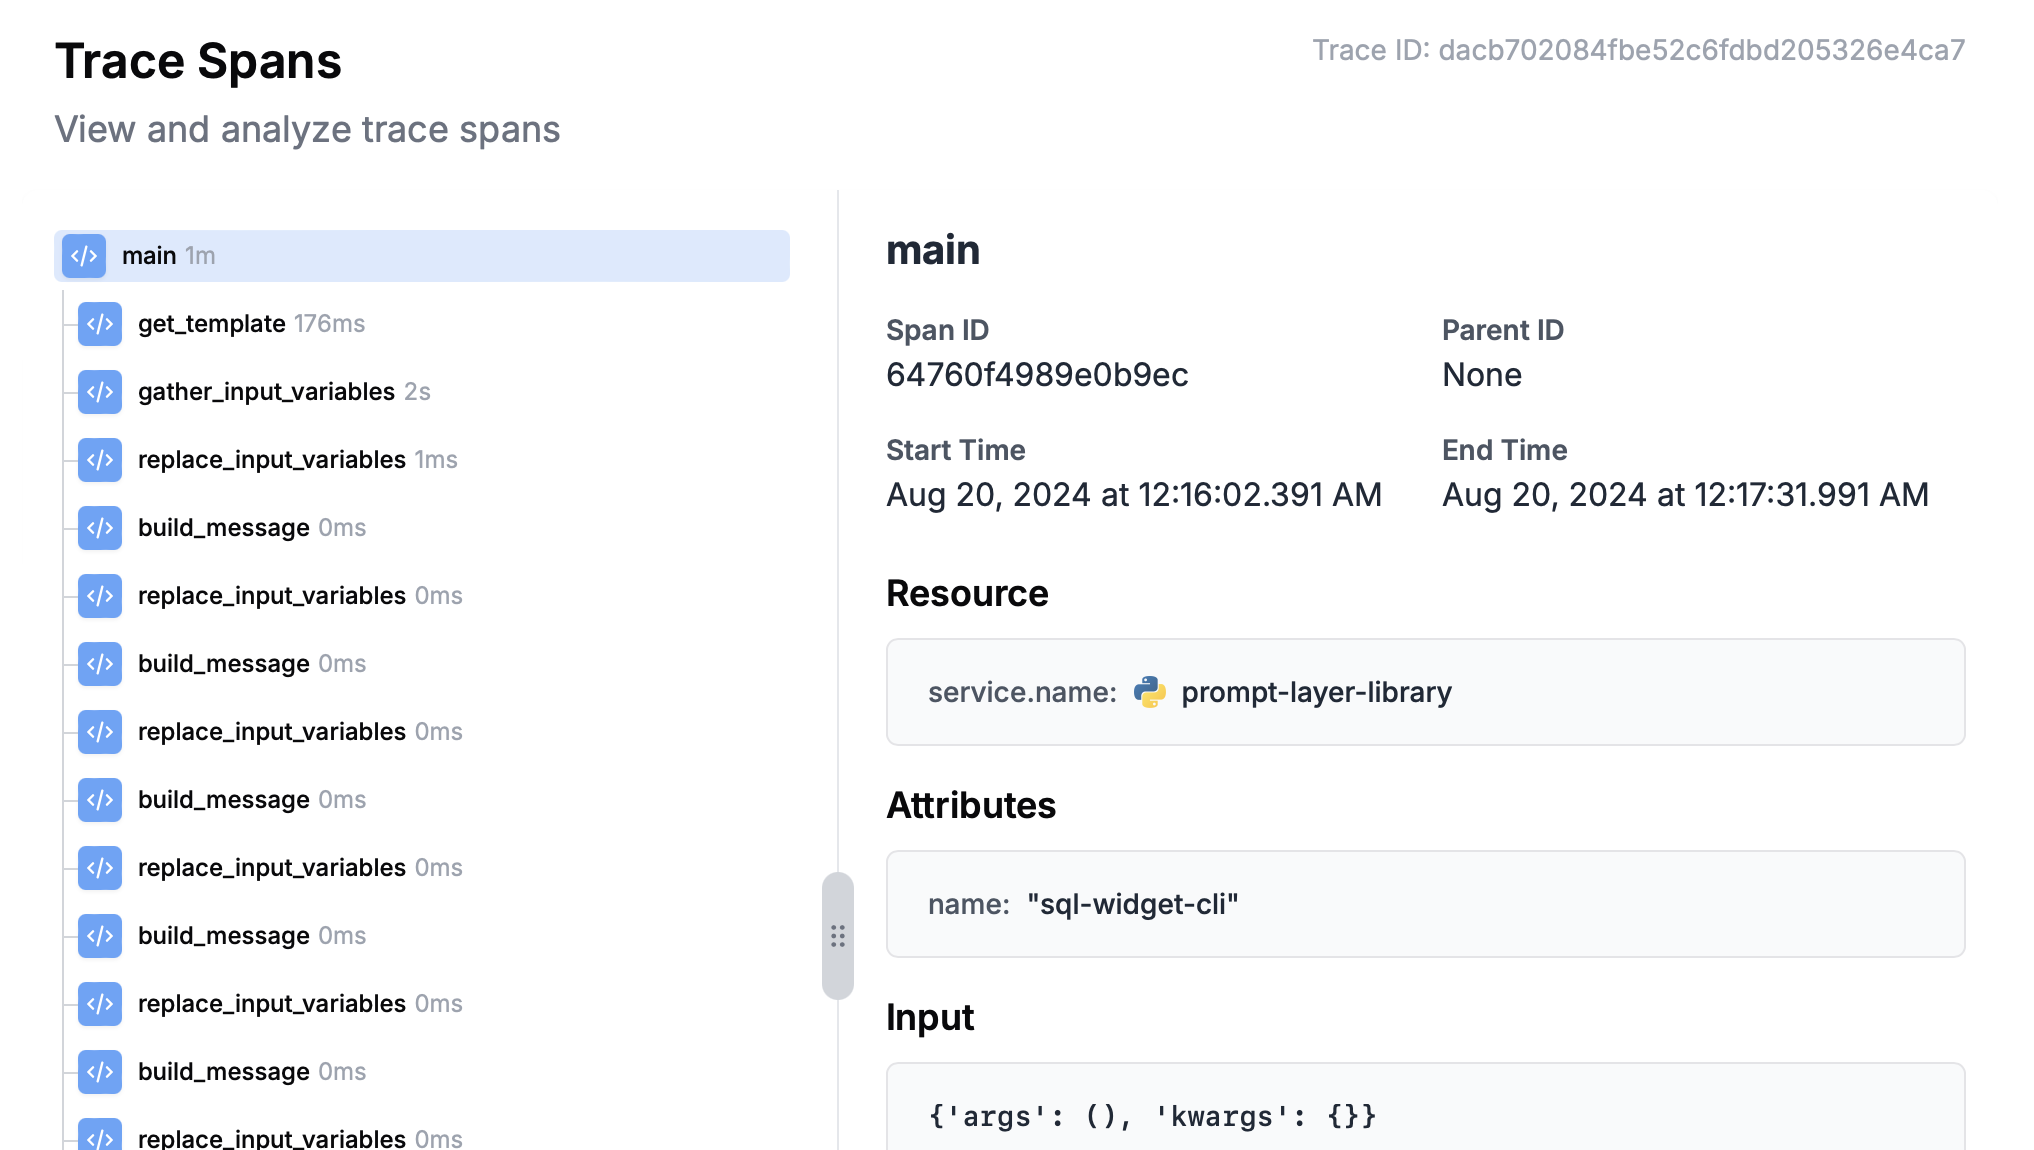
Traces in PromptLayer offer a comprehensive view of your application’s performance and behavior. They allow you to:- Visualize the execution flow of your functions
- Track LLM requests and their associated metadata
- Measure function durations and identify performance bottlenecks
- Inspect function inputs and outputs for debugging

Automatic LLM Request Tracing
When you initialize the PromptLayer class withenable_tracing set to True, PromptLayer will automatically track any LLM calls made using the PromptLayer library. This allows you to capture detailed information about your LLM requests, including:
- Model used
- Input prompts
- Generated responses
- Request duration
- Associated metadata
run() method to execute prompts. All LLM calls made through this method will be automatically traced, providing detailed insights into your prompt executions.
Custom Function Tracing
In addition to automatic LLM request tracing, you can also use thetraceable decorator (for Python) or wrapWithSpan (for JavaScript) to explicitly track span data for additional functions. This allows you to gather detailed information about function executions.

