

- Model input and output
- Provider and model
- Start time, end time, and latency
- Input and output tokens
- Estimated cost
- Status and error details
- Prompt template association
- Tags, metadata, scores, Signals, and a PromptLayer request ID
View Request Logs
Open Request Logs in the PromptLayer sidebar. The Requests table shows the model, prompt, status, timing, token usage, cost, and other fields for each call. Select a row to open its full details.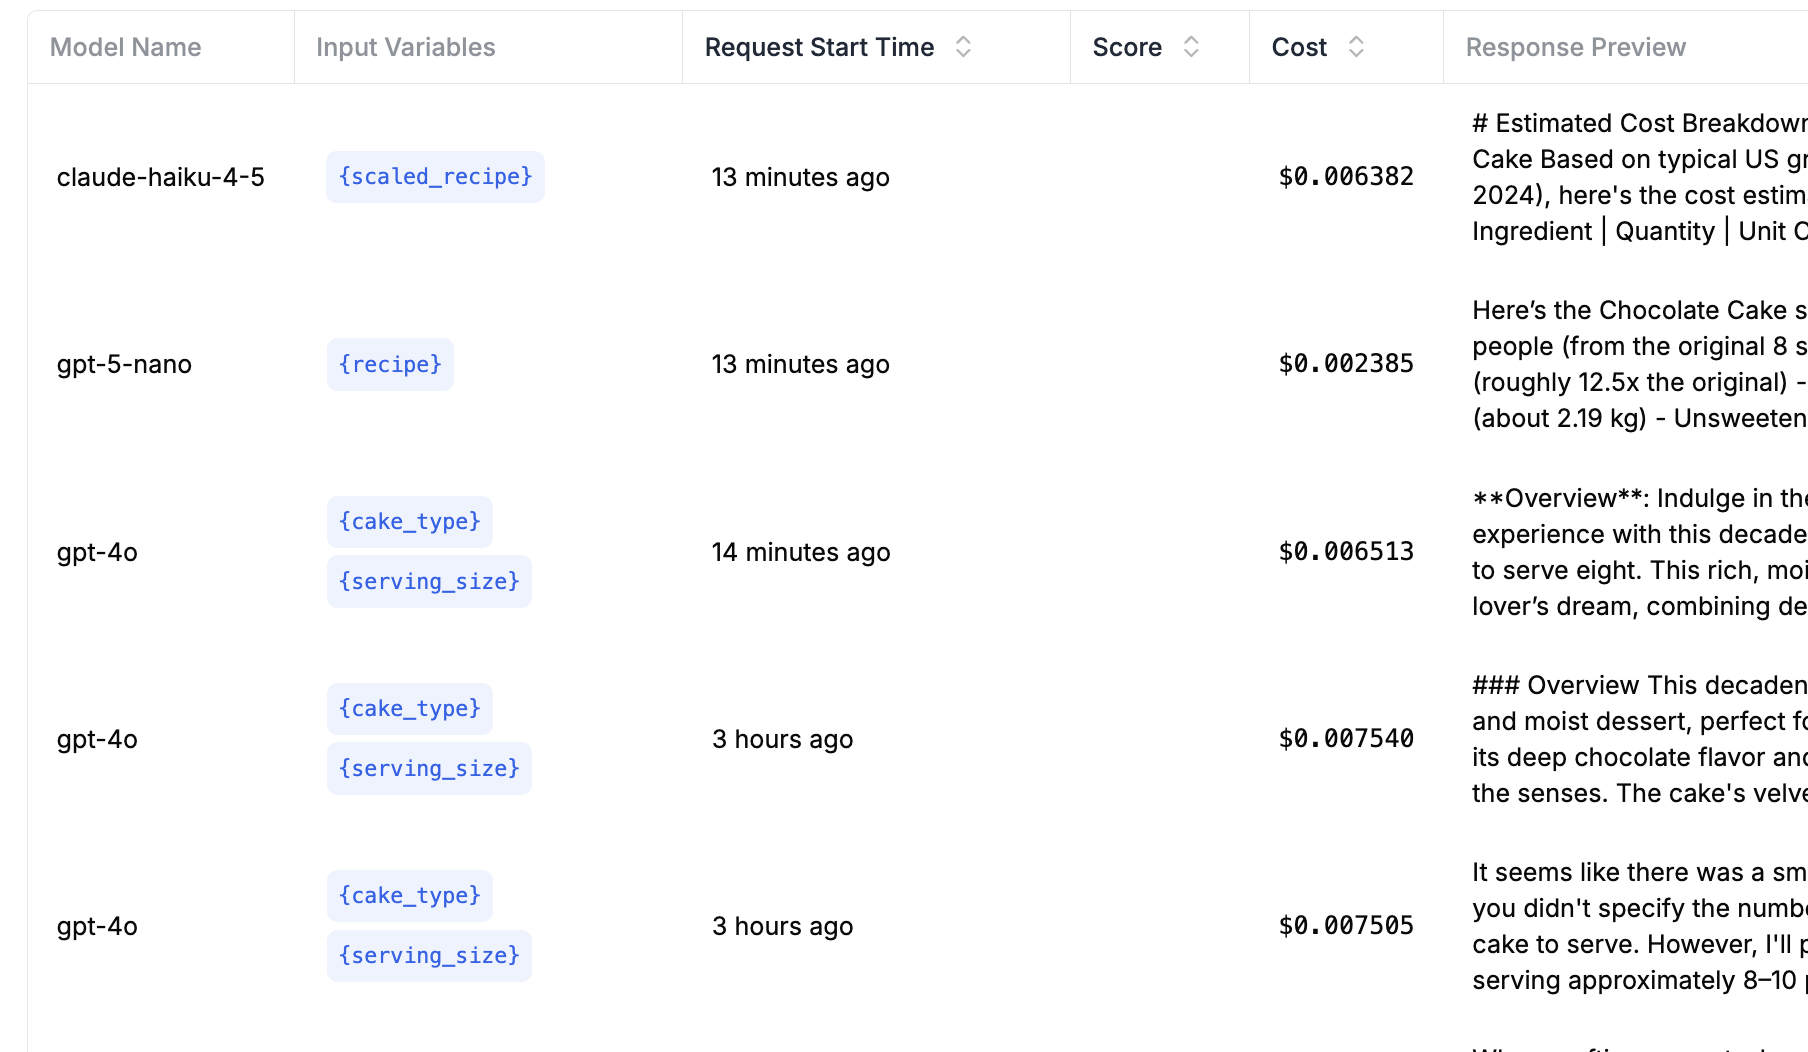
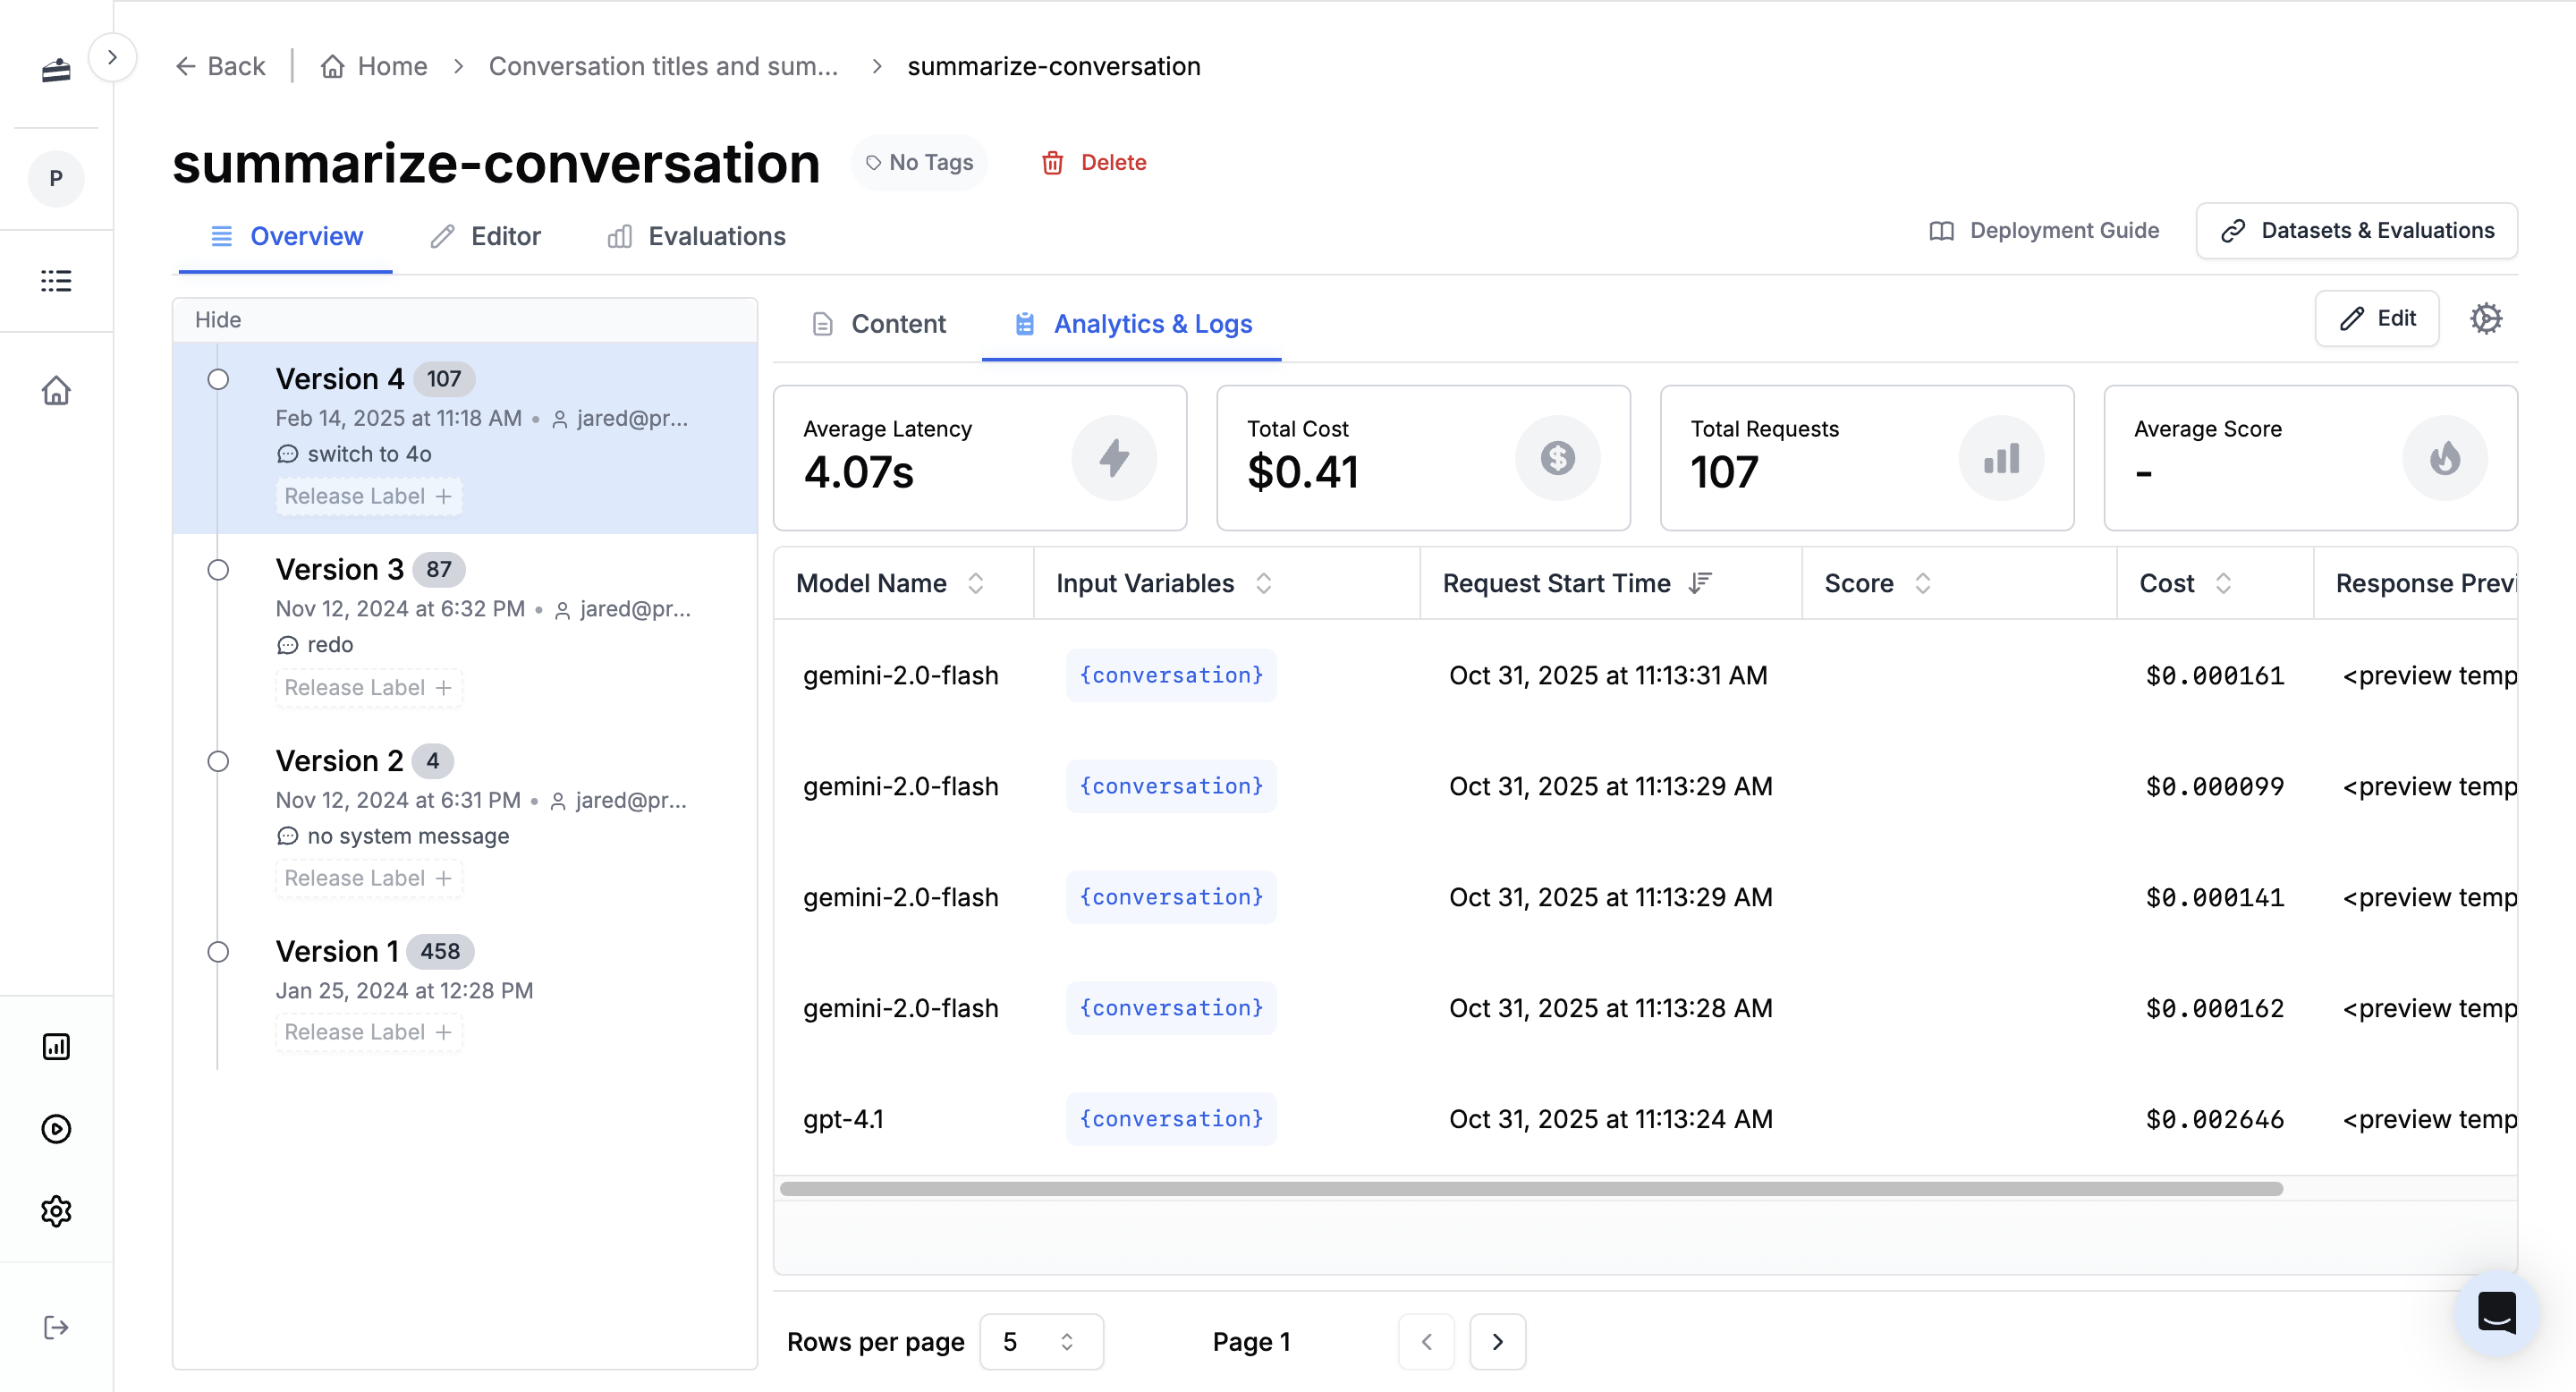
Find a Request
Use the date range, free-text query, and structured filters above the Requests table. You can filter by fields such as prompt, model, provider, status, tags, metadata, Signals, content, latency, tokens, and cost. See Search for the dashboard workflow, supported filter categories, and older-data behavior.Request Logs and Traces
A request log describes one model call. A trace describes the complete operation around that call and can contain multiple request logs. When PromptLayer receives a supported GenAI span, it creates a request log for the model call and links it to the trace. IfPromptLayer.run() already created the request log, PromptLayer links the span to that log instead of creating a duplicate.