Understand PromptLayer traces and choose how to instrument your application.
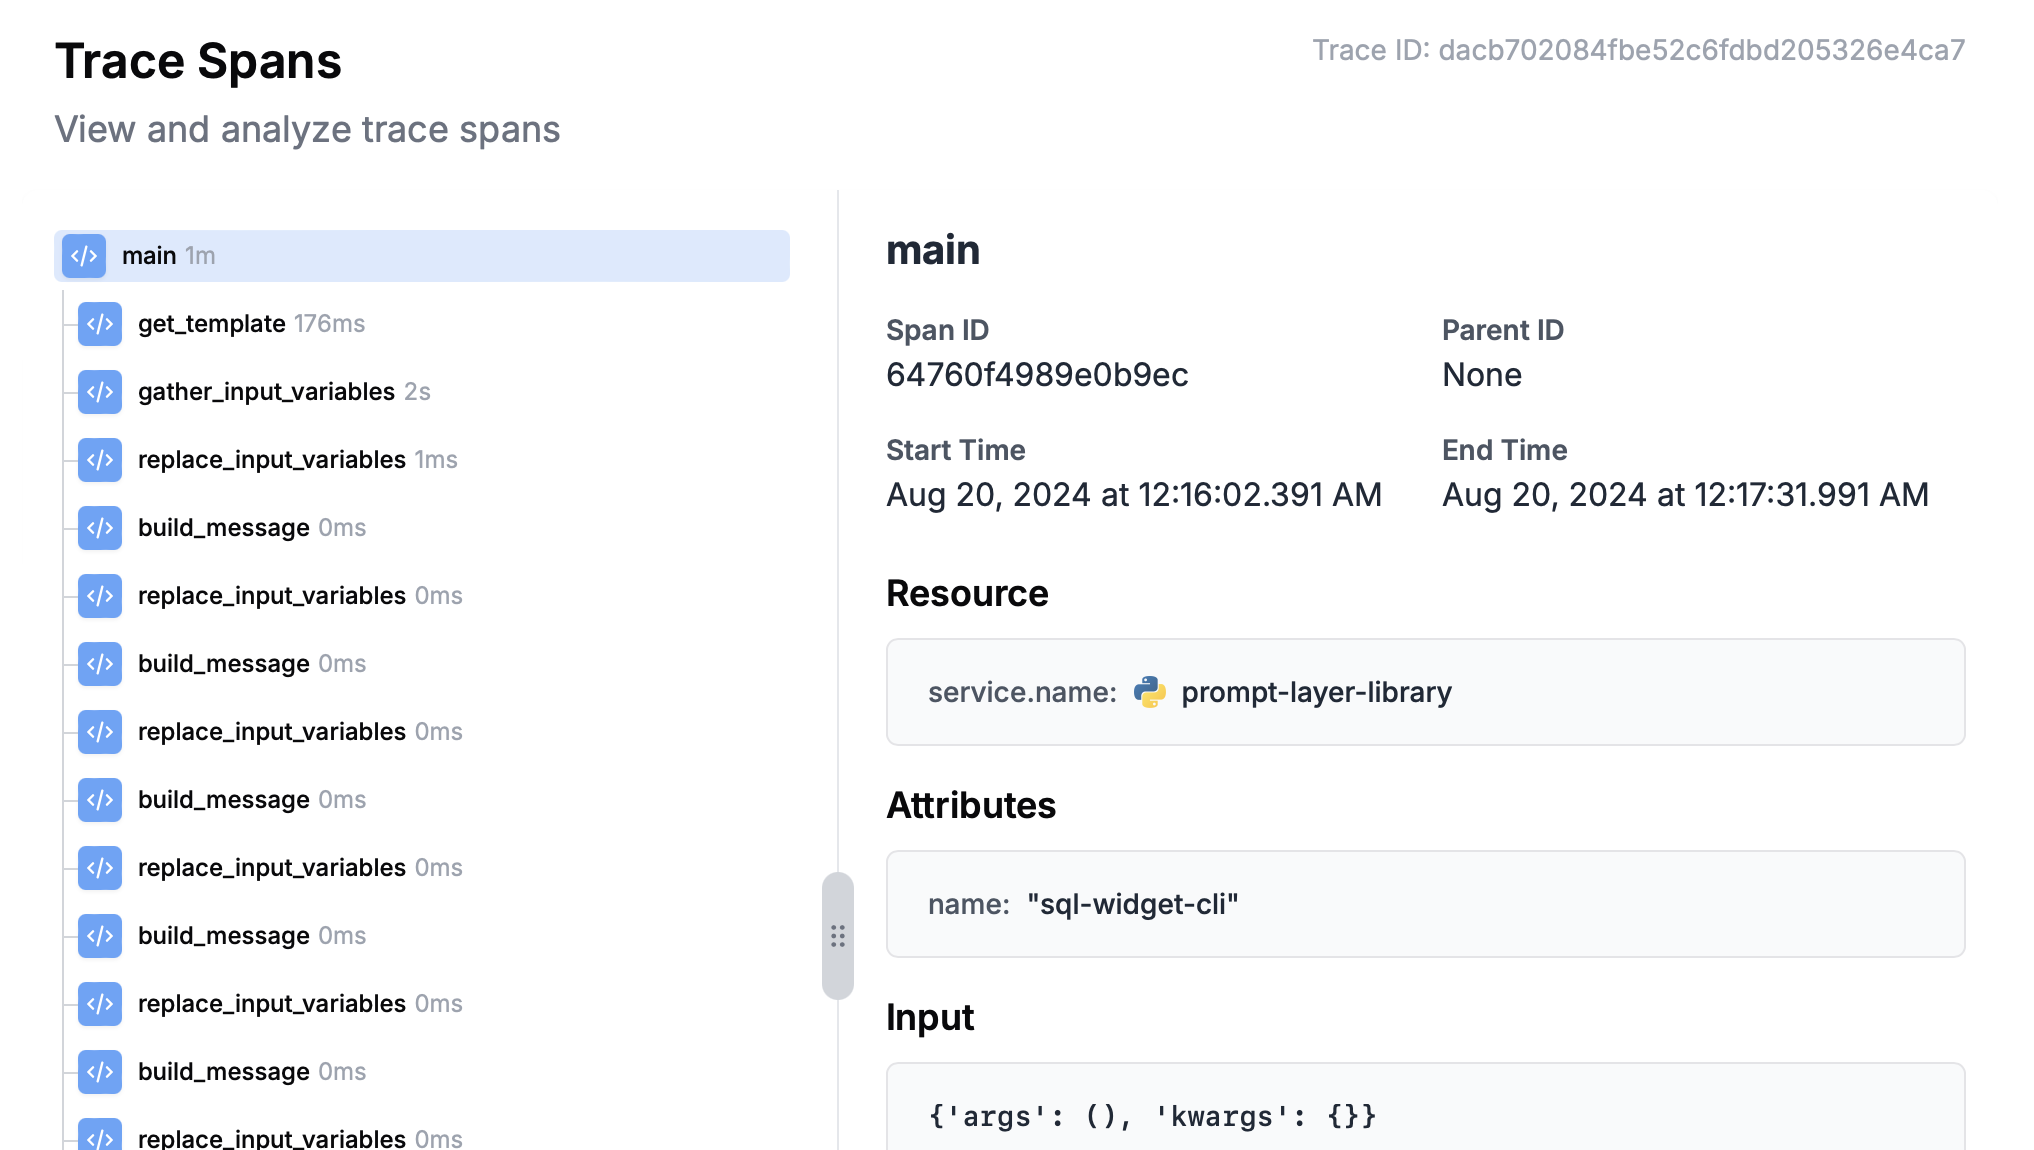
A trace represents one end-to-end operation in your application. It contains a hierarchy of spans, where each span records one timed step such as an LLM call, agent run, tool call, retrieval step, or application function.Supported LLM spans link to PromptLayer request logs, so you can move from the full execution path to the input, output, model, tokens, cost, and metadata for an individual model call.
The trace view shows parent-child relationships, duration, status, attributes, inputs, outputs, and linked request logs. Root spans represent the full operation; child spans represent the work performed inside it.
The trace list shows root spans. For a long-running operation, child spans can reach PromptLayer before the root span finishes, but the complete trace appears in the list after the root span ends.
The trace list can be filtered by metadata and resource attribute values. Filters search the entire span hierarchy: a trace appears if any root or child span has a matching attribute.In the span detail panel, hover over a top-level string, number, or boolean attribute and select the filter button to add that value to the trace list filters. Nested objects and arrays can be inspected but cannot be used as direct filter values.
Trace analytics can aggregate whole traces or individual spans. Use Analytics for charts and the PromptLayer AI assistant. For the exact trace- and span-level fields available through the public API, see Trace Analytics - Custom Queries.To collect traces from an agent runner inside an SDK evaluation, see Agent Tracing for Evals.
Was this page helpful?
Assistant
Responses are generated using AI and may contain mistakes.