

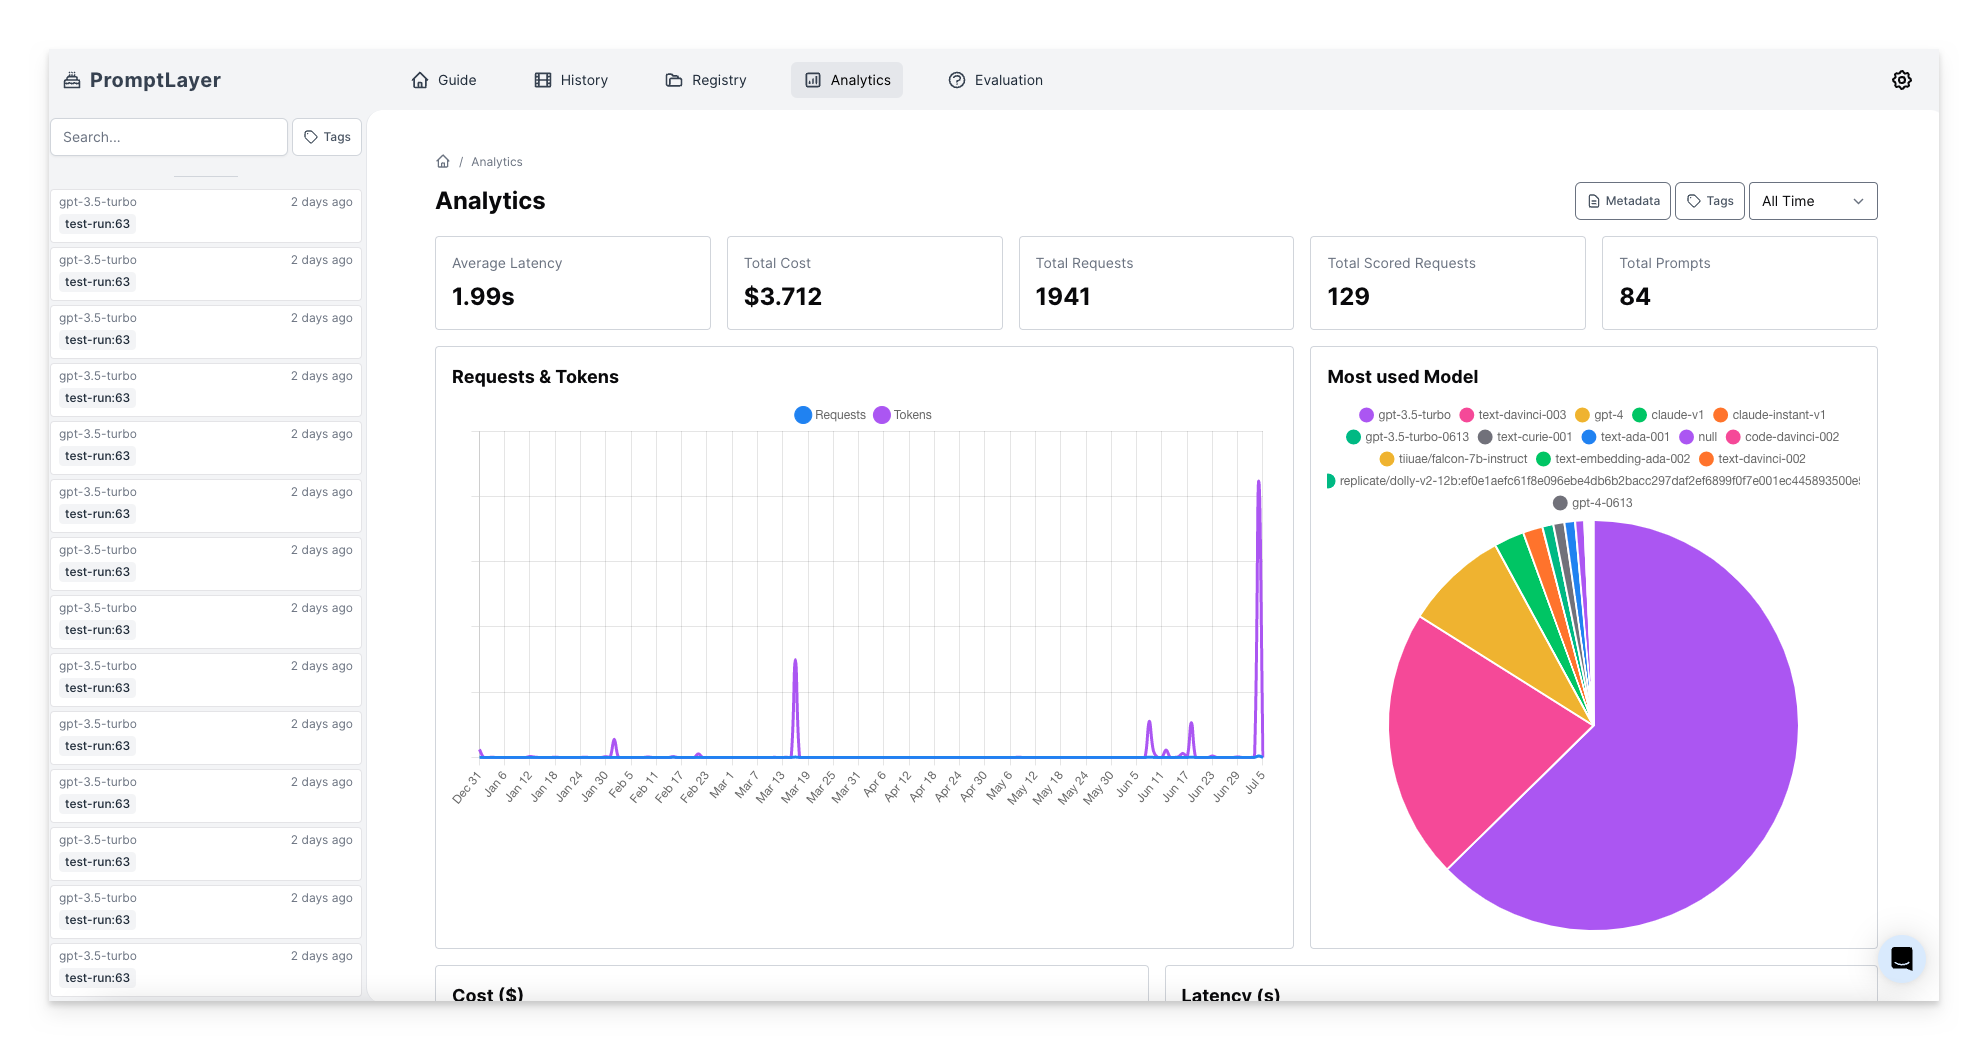
Open Analytics
- Open Request Logs or Traces in the PromptLayer sidebar.
- Set the date range and add any free-text or structured filters.
- Switch from the Requests or Traces tab to Analytics.
- Select Run query after changing the analytics query.
Request Analytics
Request analytics includes views for:- Latency, request volume, tokens, and cost over time
- Requests by model, prompt, and status
- Response format, cached tokens, and reasoning tokens
- Provider, prompt, tag, and metadata cost breakdowns
- Common errors, metadata keys, output keys, and tools
Trace Analytics
Trace analytics includes views for:- End-to-end latency, including average, p50, p90, and p95
- Trace volume and status over time
- Models and tools used across traces
- Prompt templates and workflows used across traces
- Trace- and span-level filters
Interact with Charts
Many charts can update the current query. Depending on the chart, select a point, bar, or segment to add a filter, or drag across a time-series chart to narrow the date range. Use Undo to restore the previous analytics query.Ask for an Analysis
Open the PromptLayer assistant and ask a question such as, “Create a graph of the most used prompts over the past week.” It can inspect request or trace analytics and create a chart from the relevant data.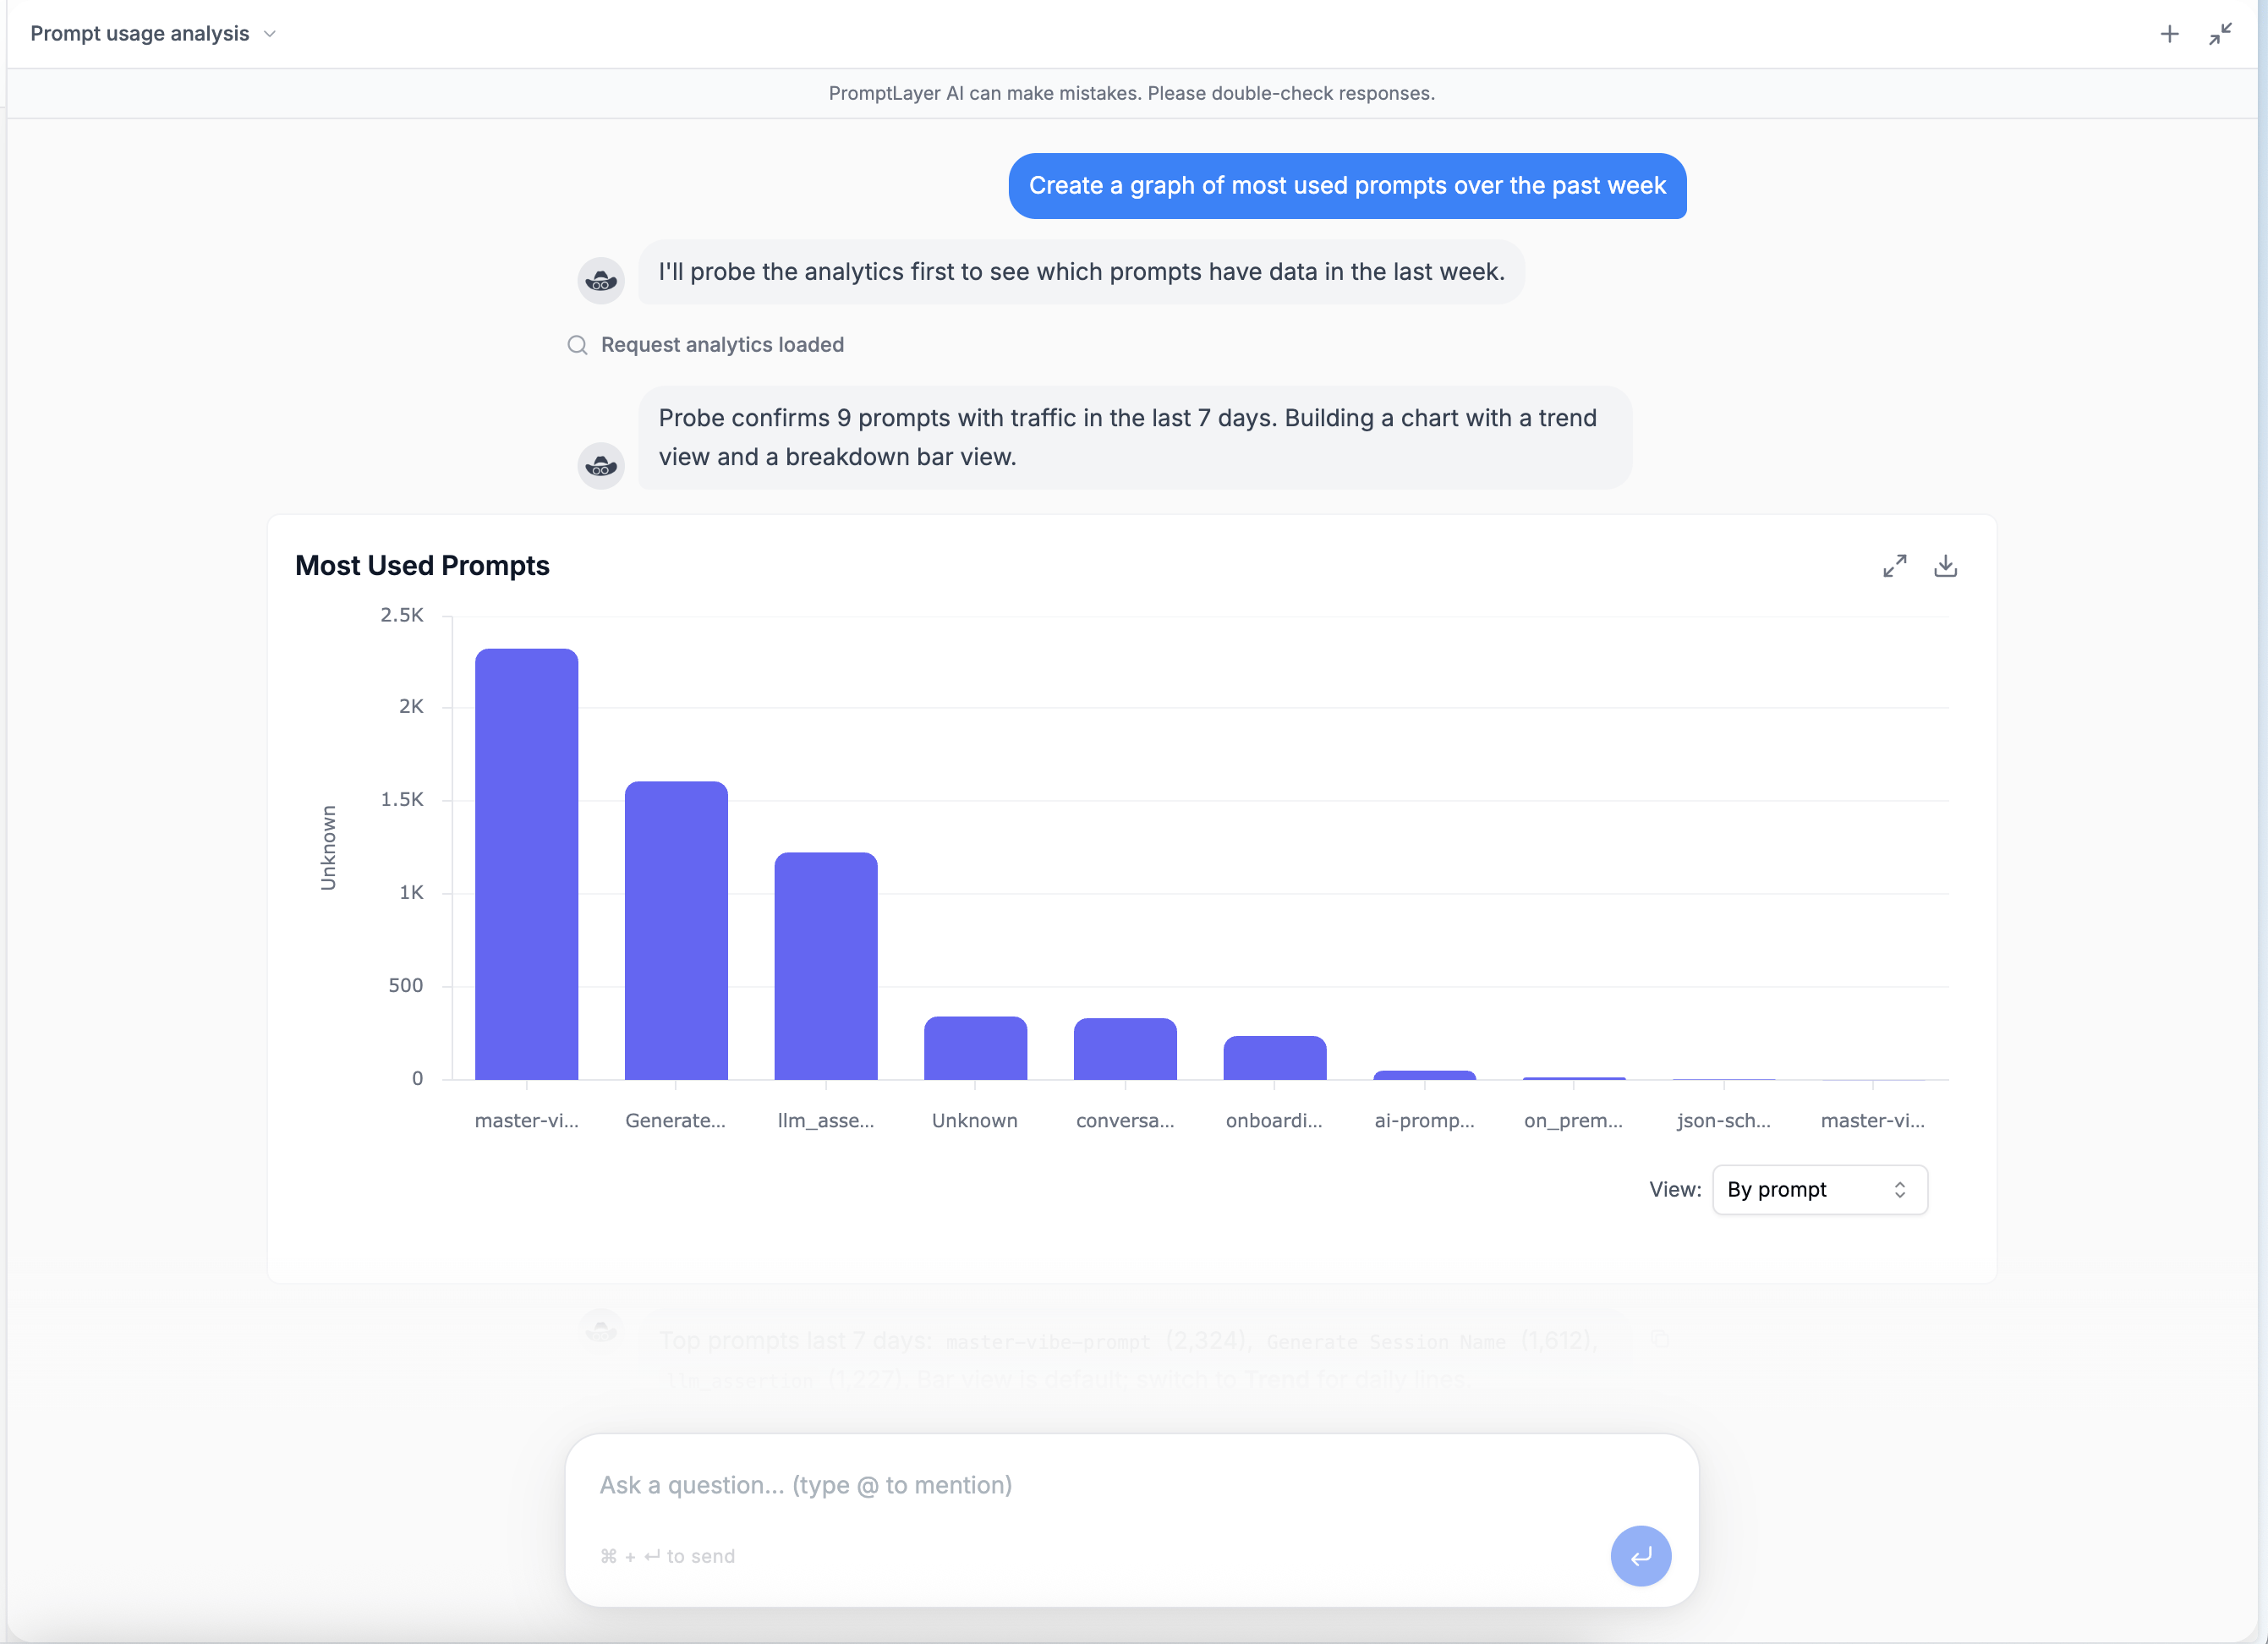
Analytics is unavailable when the selected search range includes data from before your workspace’s OpenSearch cutover date. See Search Older Data.