

PromptLayer.run() or want to add spans around application functions and tools. If a supported provider SDK or framework already produces the calls, choose its setup method from the Tracing overview.
Trace PromptLayer SDK Runs
Enable tracing when you create a PromptLayer client. Calls made throughrun() then participate in the active trace.
run() interface, see the Python SDK or JavaScript SDK.
This setting also enables installed provider auto-instrumentation. To trace direct OpenAI, Anthropic, or Google GenAI SDK calls, or Bedrock Runtime calls through Boto3 or AWS SDK v3, follow SDK Auto-Instrumentation for the required packages, supported APIs, and JavaScript initialization order.
Add Custom Spans
Usetraceable in Python or wrapWithSpan in JavaScript to record application functions that are not traced by an integration. Give important spans a descriptive name so they are easy to identify in the trace view.
name, PromptLayer uses the function name. JavaScript takes the span name as the first argument to wrapWithSpan.
Nest Spans
Traced functions called inside another active span become children of that span. When an in-process provider or framework integration preserves the active OpenTelemetry context, its spans also appear as children. This allows one trace to combine application, tool, and LLM spans.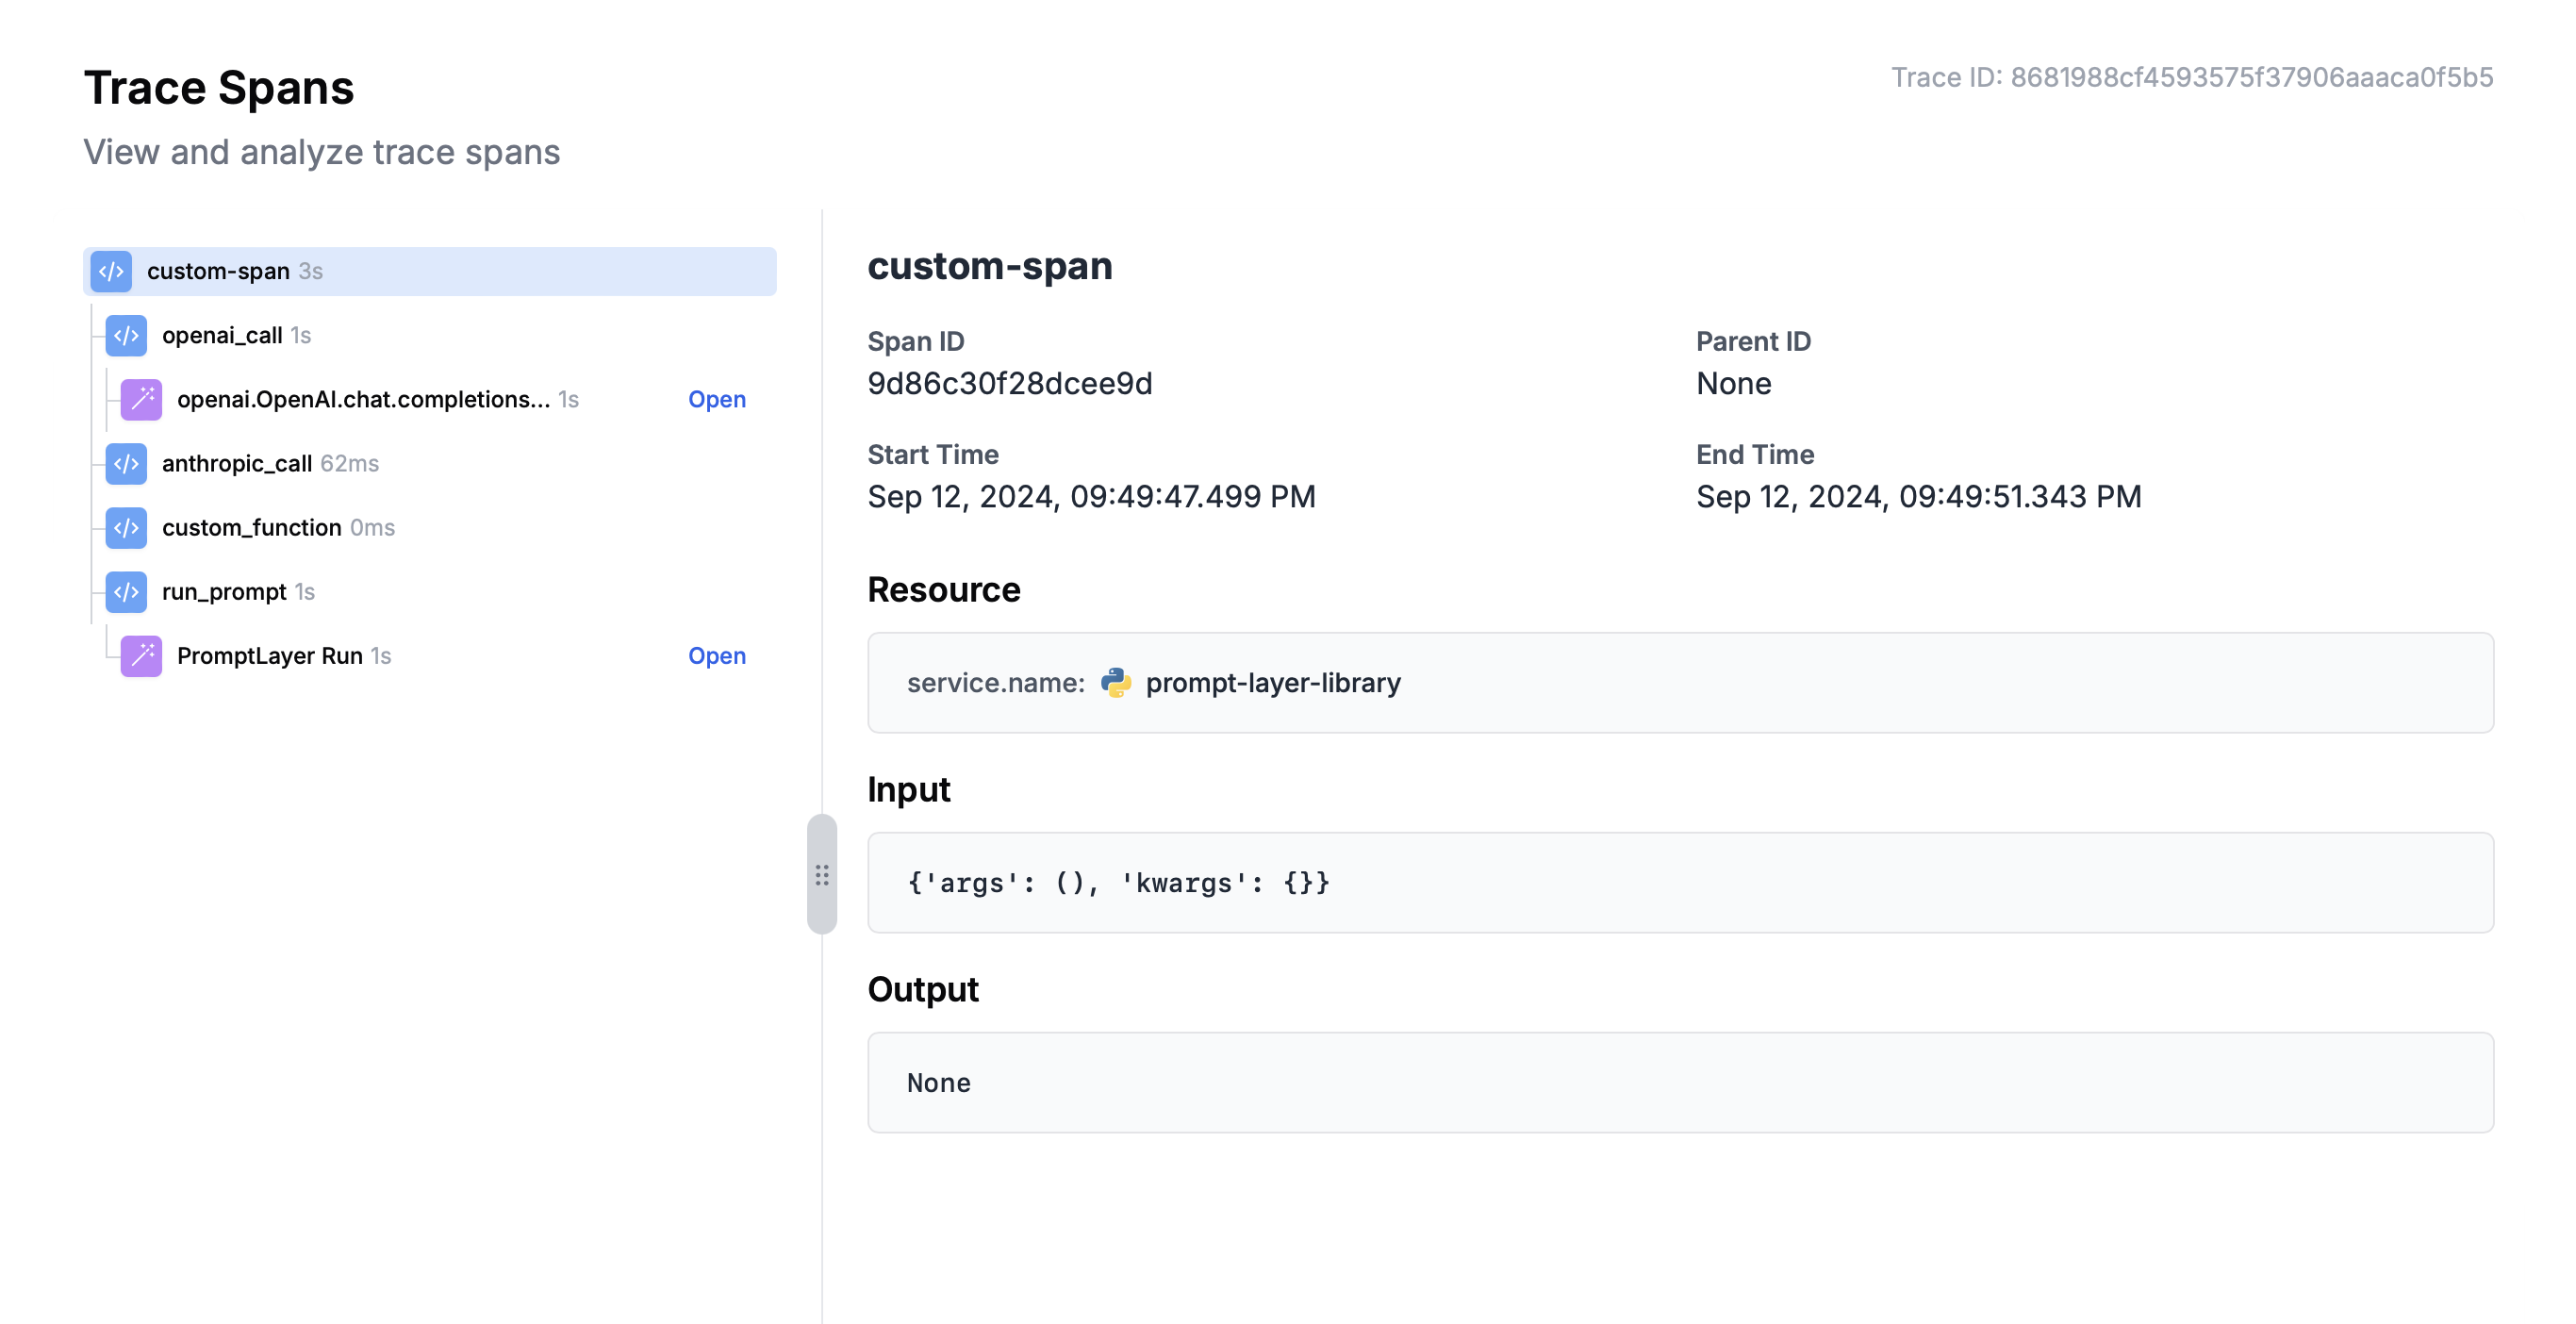
Trace Tools
UsetraceTool for tool handlers in a custom agent that does not already have a dedicated Telemetry Integration. PromptLayer names the span Tool: <name> and marks it as a tool call.
traceTool records only when tracing is enabled on the client. The tool name is also used by tool-aware features such as the Trajectory scorer.