> ## Documentation Index
> Fetch the complete documentation index at: https://docs.promptlayer.com/llms.txt
> Use this file to discover all available pages before exploring further.
# Traces
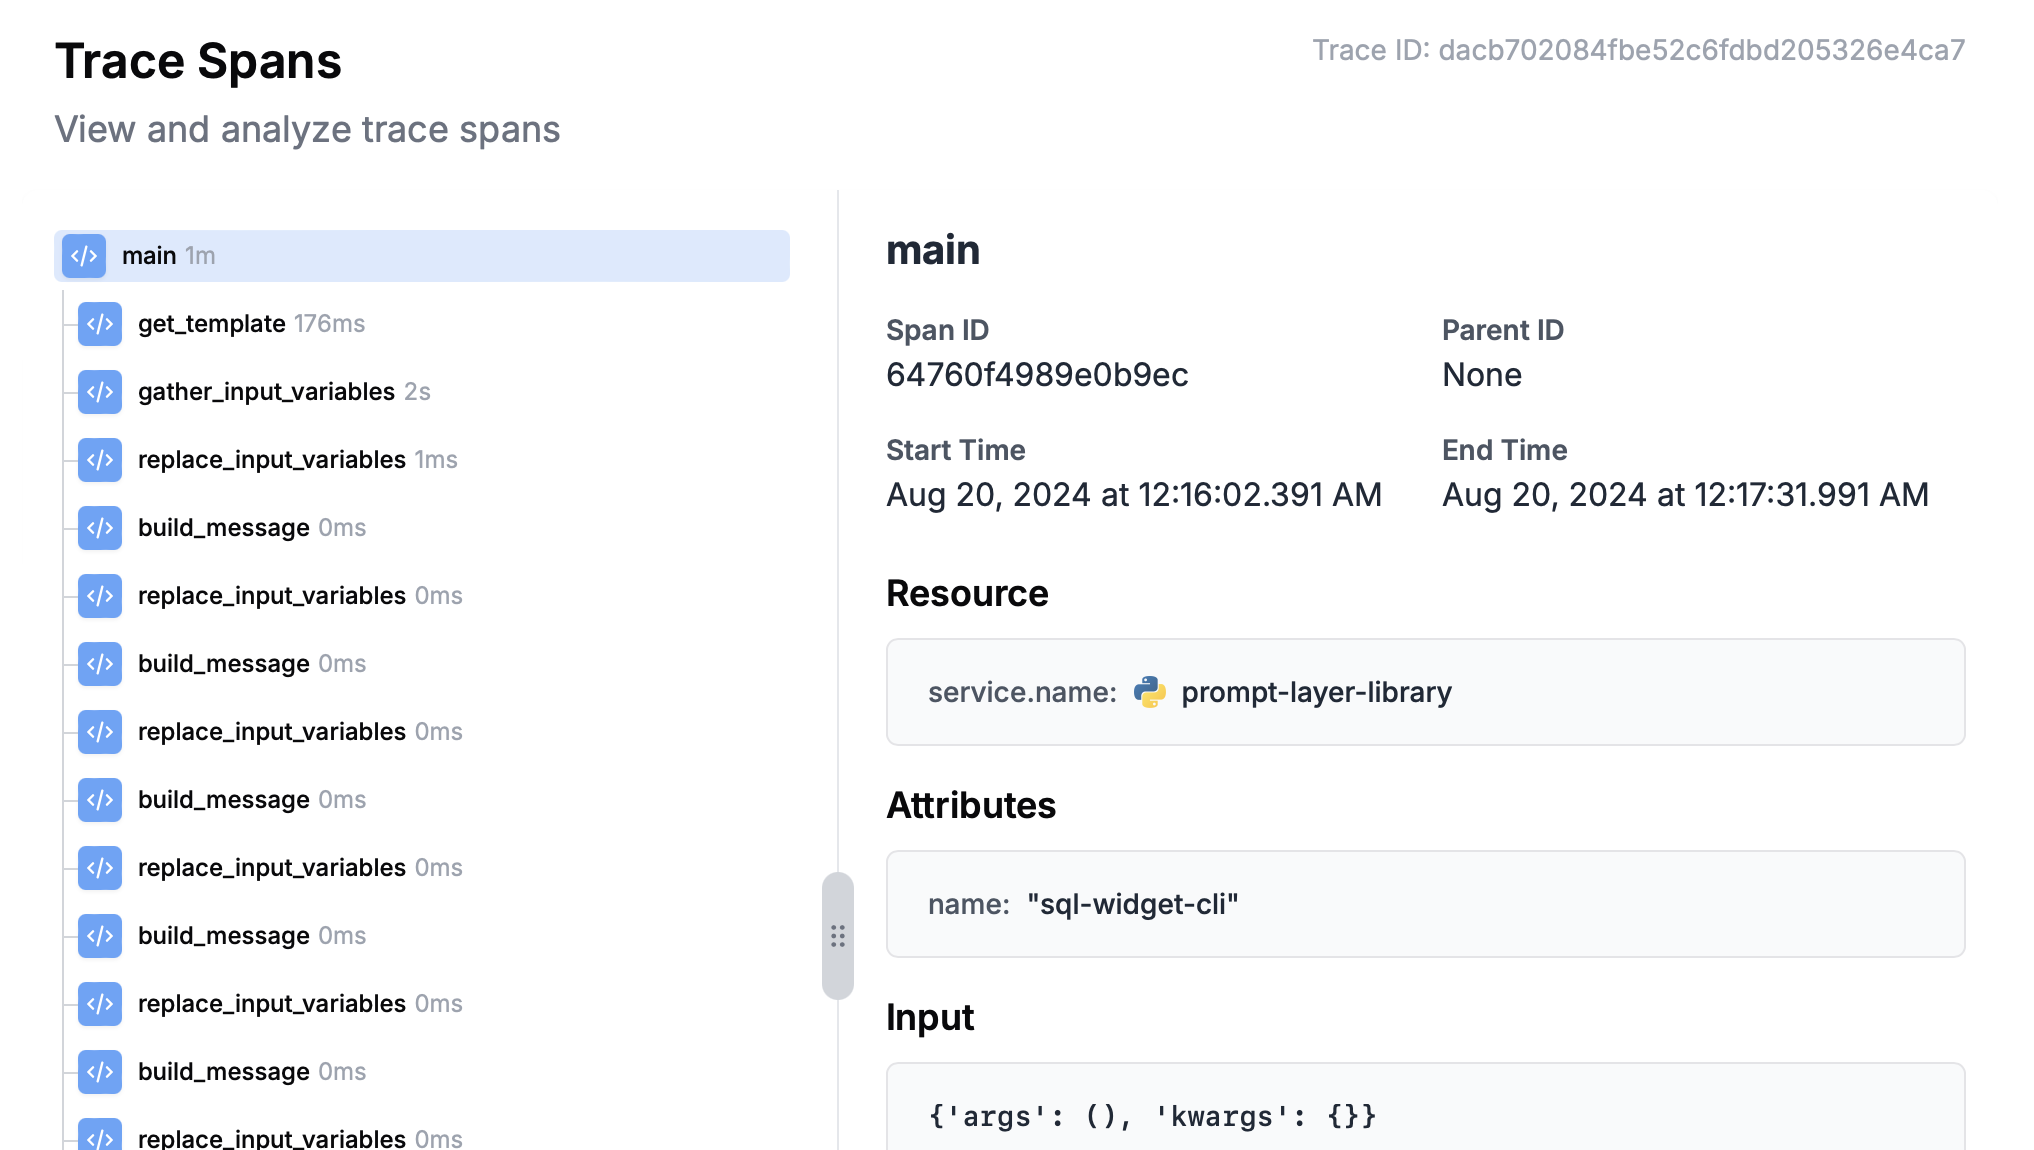
Traces are a powerful feature in PromptLayer that allow you to monitor and analyze the execution flow of your applications, including LLM requests. Built on OpenTelemetry, Traces provide detailed insights into function calls, their durations, inputs, and outputs.
This page covers tracing with the **PromptLayer SDK** (`@traceable`, `wrapWithSpan`). If you want to send traces from any OpenTelemetry SDK or Collector without using the PromptLayer SDK, see the [OpenTelemetry](/features/opentelemetry) page. For framework-specific integrations (Vercel AI SDK, OpenAI Agents, Claude Code), see [Telemetry Integrations](/features/integrations).
## Overview
Traces in PromptLayer offer a comprehensive view of your application's performance and behavior. They allow you to:
* Visualize the execution flow of your functions
* Track LLM requests and their associated metadata
* Measure function durations and identify performance bottlenecks
* Inspect function inputs and outputs for debugging
**Note:** The left menu in the PromptLayer UI only shows root spans, which represent the entry function of your program. While your program is running, you might not see all spans in the UI immediately, even though child spans are being sent to the backend. The root span, along with all its child spans, will only appear in the UI once the program completes. This behavior is particularly noticeable in long-running programs or those with complex execution flows.
 ## Automatic LLM Request Tracing
When you initialize the PromptLayer class with `enable_tracing` set to `True`, PromptLayer will automatically track any LLM calls made using the PromptLayer library. This allows you to capture detailed information about your LLM requests, including:
* Model used
* Input prompts
* Generated responses
* Request duration
* Associated metadata
```python Python theme={null}
from promptlayer import PromptLayer
# Initialize PromptLayer with tracing enabled
pl_client = PromptLayer(enable_tracing=True)
```
```javascript JavaScript theme={null}
import { PromptLayer } from "promptlayer";
// Initialize PromptLayer with tracing enabled
const promptlayer = new PromptLayer({
apiKey: process.env.PROMPTLAYER_API_KEY,
enableTracing: true,
});
```
Once PromptLayer is initialized with tracing enabled, you can use the `run()` method to execute prompts. All LLM calls made through this method will be automatically traced, providing detailed insights into your prompt executions.
```python Python theme={null}
response = pl_client.run(
prompt_name="simple-greeting",
input_variables={
"name": "Alice"
},
metadata={
"user_id": "12345"
}
)
print(response)
```
```javascript JavaScript theme={null}
async function runPrompt() {
try {
const response = await promptlayer.run({
promptName: "simple-greeting",
inputVariables: {
name: "Alice"
},
metadata: {
user_id: "12345"
}
});
console.log(response);
} catch (error) {
console.error("Error running prompt:", error);
}
}
runPrompt();
```
## Custom Function Tracing
In addition to automatic LLM request tracing, you can also use the `traceable` decorator (for Python) or `wrapWithSpan` (for JavaScript) to explicitly track span data for additional functions. This allows you to gather detailed information about function executions.
```python Python theme={null}
# Use the @pl_client.traceable() decorator to trace a function
@pl_client.traceable()
def greet(name):
return f"Hello, {name}!"
# Use the decorator with custom attributes
@pl_client.traceable(attributes={"function_type": "math"})
def calculate_sum(a, b):
return a + b
result1 = greet("Alice")
print(result1)
result2 = calculate_sum(5, 3)
print(result2)
```
```javascript JavaScript theme={null}
// Define and wrap a function with PromptLayer tracing
const greet = promptlayer.wrapWithSpan('greet', (name: string): string => {
return `Hello, ${name}!`;
});
const result = greet("Alice");
console.log(result);
```
## Setting Custom Span Names
When tracing functions, you may want to set custom names for your spans to make them more descriptive. Both Python and JavaScript implementations of PromptLayer allow you to set custom span names.
### Python
In Python, you can set a custom span name by passing the `name` parameter to the `traceable` decorator:
```python theme={null}
@pl_client.traceable(name="CustomGreeting")
def greet(name):
return f"Hello, {name}!"
result = greet("Alice")
print(result)
```
If you don't provide a name parameter, the span will use the function's name by default.
### JavaScript
In JavaScript, you can set a custom span name by passing it as the first argument to the wrapWithSpan function:
```javascript JavaScript theme={null}
const greet = promptlayer.wrapWithSpan('CustomGreeting', (name) => {
return `Hello, ${name}!`;
});
const result = greet("Alice");
console.log(result);
```
If you want to use the function's name as the span name, you can simply pass the function name as a string:
```javascript JavaScript theme={null}
const greet = promptlayer.wrapWithSpan('greet', (name) => {
return `Hello, ${name}!`;
});
```
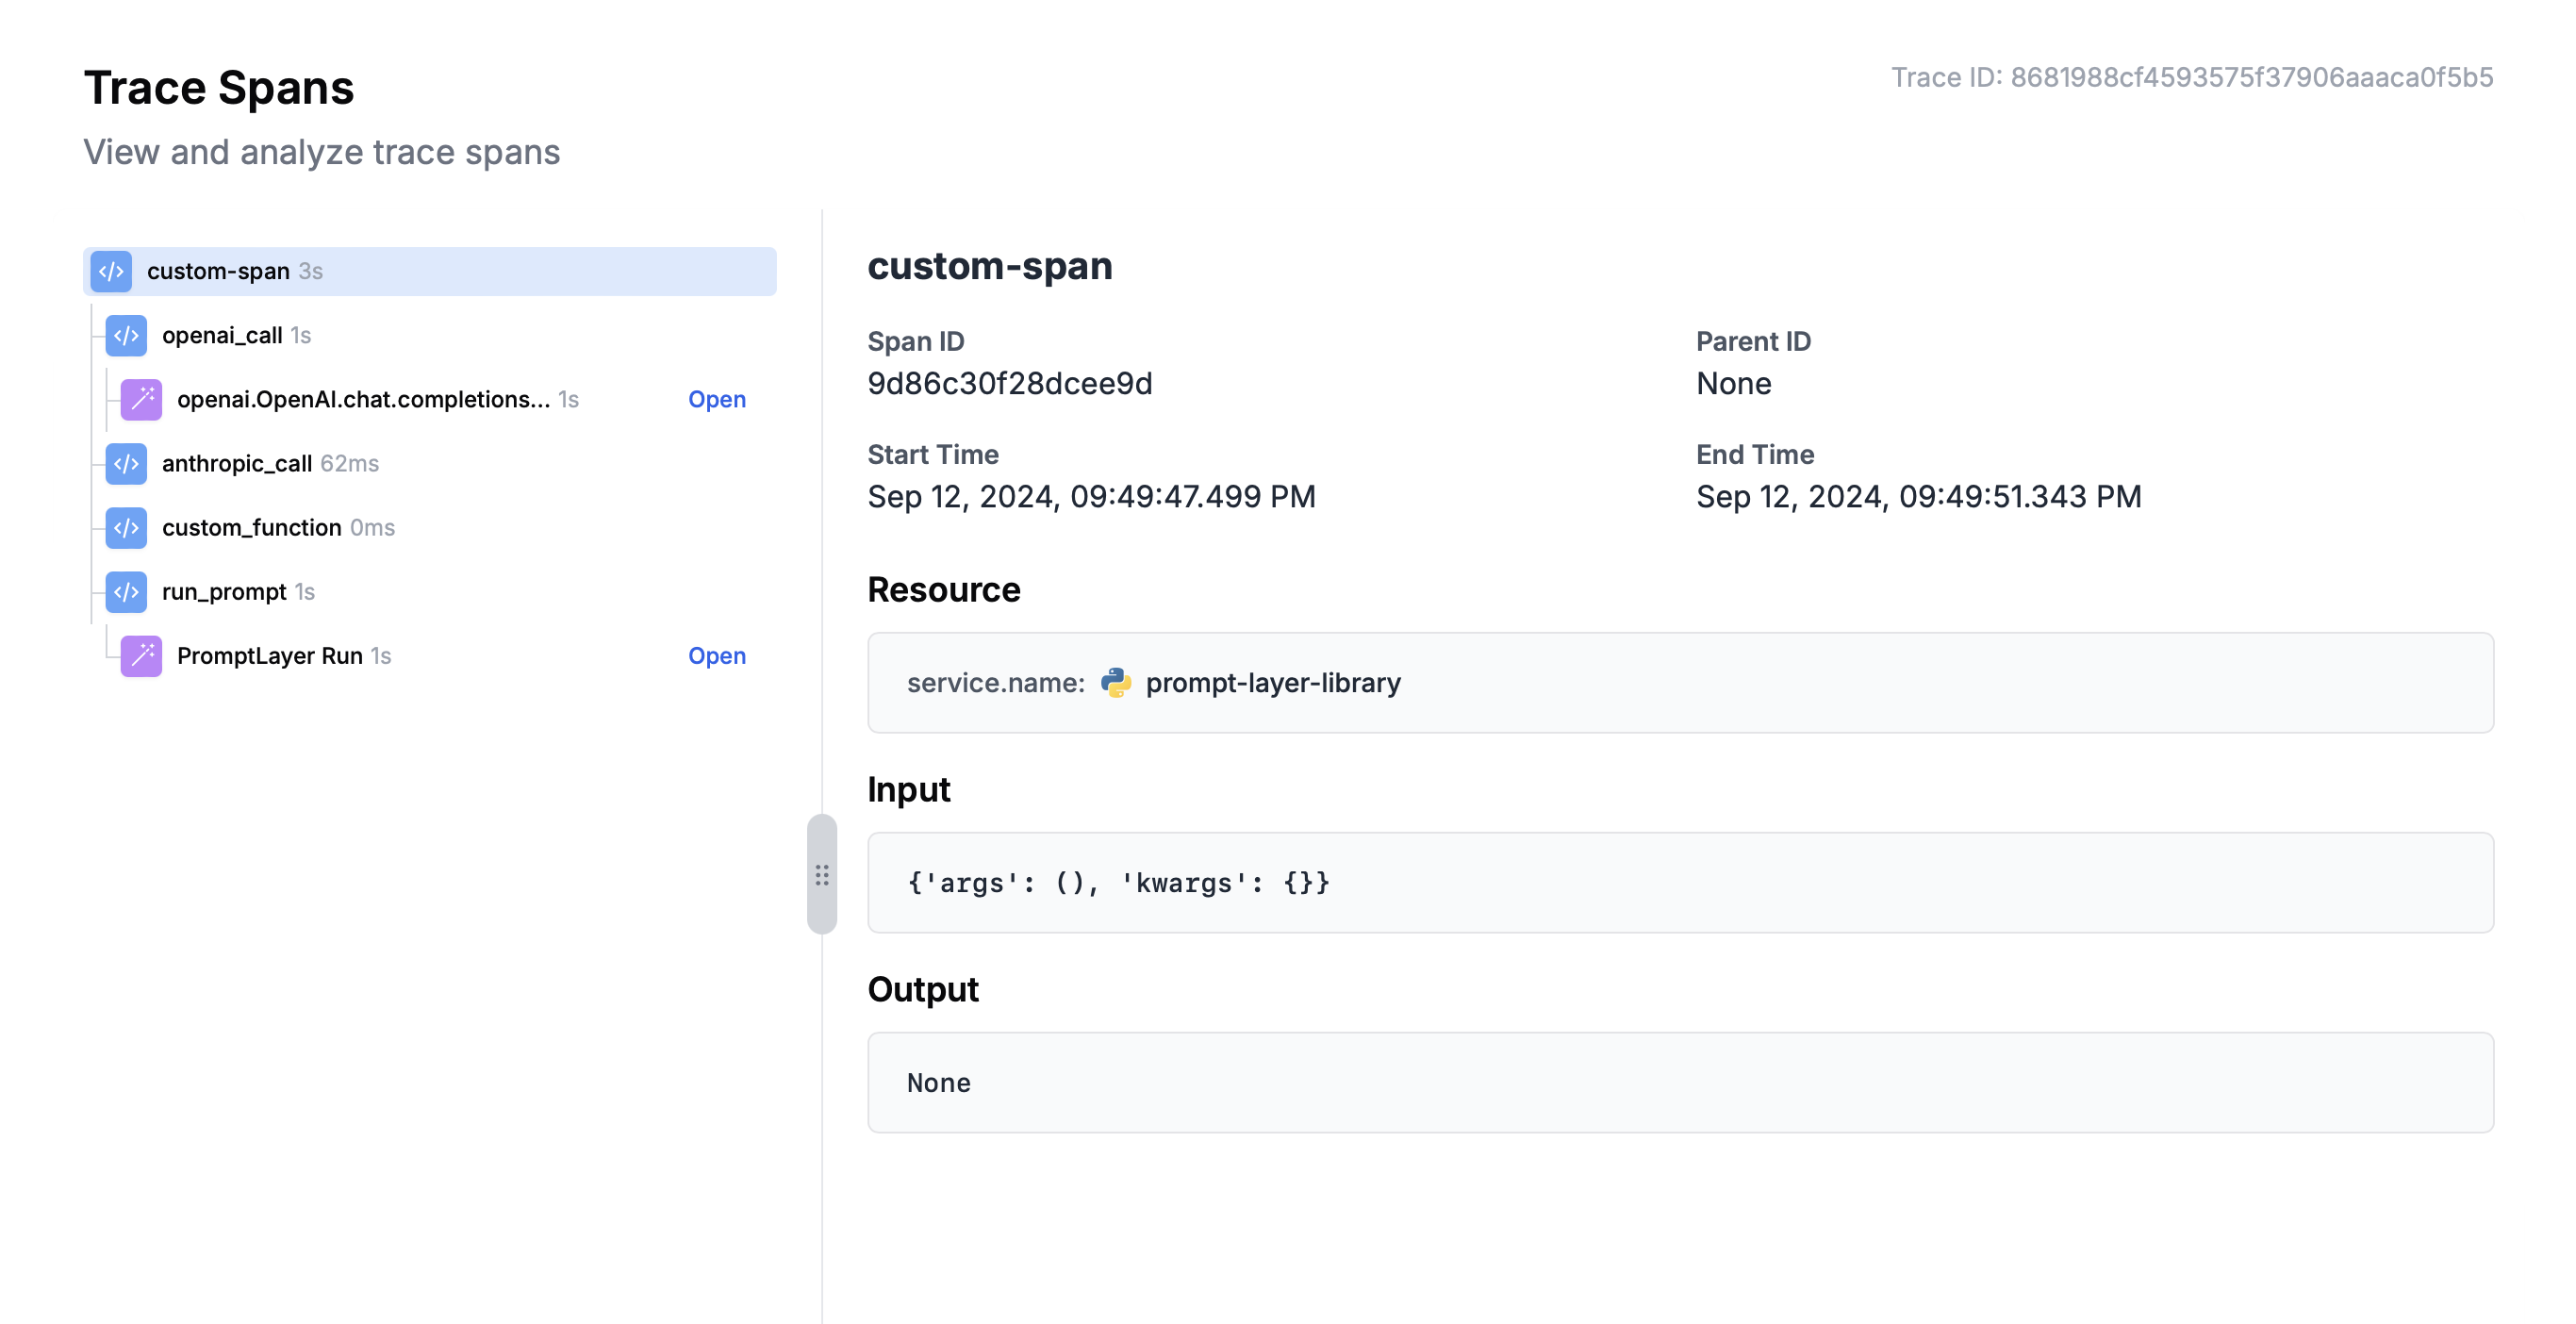
## Creating Parent Spans and Grouping Function Calls
To create a parent span and group multiple function calls within it, you can use the traceable decorator on a main function that calls other traced functions.
Here's an example that demonstrates this concept:
```python theme={null}
from promptlayer import PromptLayer
# Initialize PromptLayer with tracing enabled
pl_client = PromptLayer(enable_tracing=True)
@pl_client.traceable(name="custom-span")
def main():
# This function will be the parent span
openai_call()
anthropic_call()
custom_function()
run_prompt()
@pl_client.traceable()
def openai_call():
response = pl_client.run(
prompt_name="simple-greeting",
input_variables={}
)
print("OpenAI response:", response["prompt_blueprint"]["prompt_template"]["messages"][-1])
@pl_client.traceable()
def anthropic_call():
response = pl_client.run(
prompt_name="simple-greeting",
input_variables={},
provider="anthropic",
model="claude-sonnet-4-20250514"
)
print("Anthropic response:", response["prompt_blueprint"]["prompt_template"]["messages"][-1])
@pl_client.traceable()
def custom_function():
# This is a custom function that will be traced
result = "Custom function executed"
print(result)
return result
@pl_client.traceable()
def run_prompt():
response = pl_client.run(
prompt_name="simple-greeting",
input_variables={}
)
print("Prompt response:", response["prompt_blueprint"]["prompt_template"]["messages"][-1])
if __name__ == "__main__":
main()
```
## Automatic LLM Request Tracing
When you initialize the PromptLayer class with `enable_tracing` set to `True`, PromptLayer will automatically track any LLM calls made using the PromptLayer library. This allows you to capture detailed information about your LLM requests, including:
* Model used
* Input prompts
* Generated responses
* Request duration
* Associated metadata
```python Python theme={null}
from promptlayer import PromptLayer
# Initialize PromptLayer with tracing enabled
pl_client = PromptLayer(enable_tracing=True)
```
```javascript JavaScript theme={null}
import { PromptLayer } from "promptlayer";
// Initialize PromptLayer with tracing enabled
const promptlayer = new PromptLayer({
apiKey: process.env.PROMPTLAYER_API_KEY,
enableTracing: true,
});
```
Once PromptLayer is initialized with tracing enabled, you can use the `run()` method to execute prompts. All LLM calls made through this method will be automatically traced, providing detailed insights into your prompt executions.
```python Python theme={null}
response = pl_client.run(
prompt_name="simple-greeting",
input_variables={
"name": "Alice"
},
metadata={
"user_id": "12345"
}
)
print(response)
```
```javascript JavaScript theme={null}
async function runPrompt() {
try {
const response = await promptlayer.run({
promptName: "simple-greeting",
inputVariables: {
name: "Alice"
},
metadata: {
user_id: "12345"
}
});
console.log(response);
} catch (error) {
console.error("Error running prompt:", error);
}
}
runPrompt();
```
## Custom Function Tracing
In addition to automatic LLM request tracing, you can also use the `traceable` decorator (for Python) or `wrapWithSpan` (for JavaScript) to explicitly track span data for additional functions. This allows you to gather detailed information about function executions.
```python Python theme={null}
# Use the @pl_client.traceable() decorator to trace a function
@pl_client.traceable()
def greet(name):
return f"Hello, {name}!"
# Use the decorator with custom attributes
@pl_client.traceable(attributes={"function_type": "math"})
def calculate_sum(a, b):
return a + b
result1 = greet("Alice")
print(result1)
result2 = calculate_sum(5, 3)
print(result2)
```
```javascript JavaScript theme={null}
// Define and wrap a function with PromptLayer tracing
const greet = promptlayer.wrapWithSpan('greet', (name: string): string => {
return `Hello, ${name}!`;
});
const result = greet("Alice");
console.log(result);
```
## Setting Custom Span Names
When tracing functions, you may want to set custom names for your spans to make them more descriptive. Both Python and JavaScript implementations of PromptLayer allow you to set custom span names.
### Python
In Python, you can set a custom span name by passing the `name` parameter to the `traceable` decorator:
```python theme={null}
@pl_client.traceable(name="CustomGreeting")
def greet(name):
return f"Hello, {name}!"
result = greet("Alice")
print(result)
```
If you don't provide a name parameter, the span will use the function's name by default.
### JavaScript
In JavaScript, you can set a custom span name by passing it as the first argument to the wrapWithSpan function:
```javascript JavaScript theme={null}
const greet = promptlayer.wrapWithSpan('CustomGreeting', (name) => {
return `Hello, ${name}!`;
});
const result = greet("Alice");
console.log(result);
```
If you want to use the function's name as the span name, you can simply pass the function name as a string:
```javascript JavaScript theme={null}
const greet = promptlayer.wrapWithSpan('greet', (name) => {
return `Hello, ${name}!`;
});
```
## Creating Parent Spans and Grouping Function Calls
To create a parent span and group multiple function calls within it, you can use the traceable decorator on a main function that calls other traced functions.
Here's an example that demonstrates this concept:
```python theme={null}
from promptlayer import PromptLayer
# Initialize PromptLayer with tracing enabled
pl_client = PromptLayer(enable_tracing=True)
@pl_client.traceable(name="custom-span")
def main():
# This function will be the parent span
openai_call()
anthropic_call()
custom_function()
run_prompt()
@pl_client.traceable()
def openai_call():
response = pl_client.run(
prompt_name="simple-greeting",
input_variables={}
)
print("OpenAI response:", response["prompt_blueprint"]["prompt_template"]["messages"][-1])
@pl_client.traceable()
def anthropic_call():
response = pl_client.run(
prompt_name="simple-greeting",
input_variables={},
provider="anthropic",
model="claude-sonnet-4-20250514"
)
print("Anthropic response:", response["prompt_blueprint"]["prompt_template"]["messages"][-1])
@pl_client.traceable()
def custom_function():
# This is a custom function that will be traced
result = "Custom function executed"
print(result)
return result
@pl_client.traceable()
def run_prompt():
response = pl_client.run(
prompt_name="simple-greeting",
input_variables={}
)
print("Prompt response:", response["prompt_blueprint"]["prompt_template"]["messages"][-1])
if __name__ == "__main__":
main()
```
 ## Filtering Traces by Span Attributes
The trace list can be filtered by metadata and resource attribute values. Filters search across the **entire span hierarchy** — a trace appears in results if any span within it (root or child) carries a matching attribute.
For example, if only a nested LLM call span has `{"environment": "production"}` in its attributes, filtering the trace list by `environment = production` will still surface the parent trace in results, even if the root span itself does not carry that attribute.
### Adding Filters from the Span Detail Panel
When you open a span in the trace detail view, hovering over a scalar metadata or resource value reveals a filter button. Clicking it adds the key-value pair as an active filter on the trace list. The filter button appears only for top-level scalar values (string, number, or boolean). Nested objects and arrays are displayed for inspection but cannot be used as direct filter targets.
## Filtering Traces by Span Attributes
The trace list can be filtered by metadata and resource attribute values. Filters search across the **entire span hierarchy** — a trace appears in results if any span within it (root or child) carries a matching attribute.
For example, if only a nested LLM call span has `{"environment": "production"}` in its attributes, filtering the trace list by `environment = production` will still surface the parent trace in results, even if the root span itself does not carry that attribute.
### Adding Filters from the Span Detail Panel
When you open a span in the trace detail view, hovering over a scalar metadata or resource value reveals a filter button. Clicking it adds the key-value pair as an active filter on the trace list. The filter button appears only for top-level scalar values (string, number, or boolean). Nested objects and arrays are displayed for inspection but cannot be used as direct filter targets.