> ## Documentation Index
> Fetch the complete documentation index at: https://docs.promptlayer.com/llms.txt
> Use this file to discover all available pages before exploring further.
# Overview
> Understand the Table model and the main Tables workflow in PromptLayer.
Tables are the workspace for dataset, evaluation, backtesting, report, and batch workflows in PromptLayer. They keep inputs, computed outputs, scoring, history, and analytics together so a workflow can be built, run, and reviewed in one place.
A Table has four parts:
| Object | What it does |
| ---------- | ---------------------------------------------------------------------------------------------------------------------------------- |
| **Table** | The top-level workspace for a related evaluation or batch workflow. |
| **Sheet** | A tab with its own rows, columns, score configuration, history, and analytics. |
| **Column** | A field in the sheet. Text columns store data; computed columns run prompts, code, checks, extraction, composition, or other work. |
| **Cell** | A row-column value. Computed cells track status, including queued, running, completed, failed, and stale. |
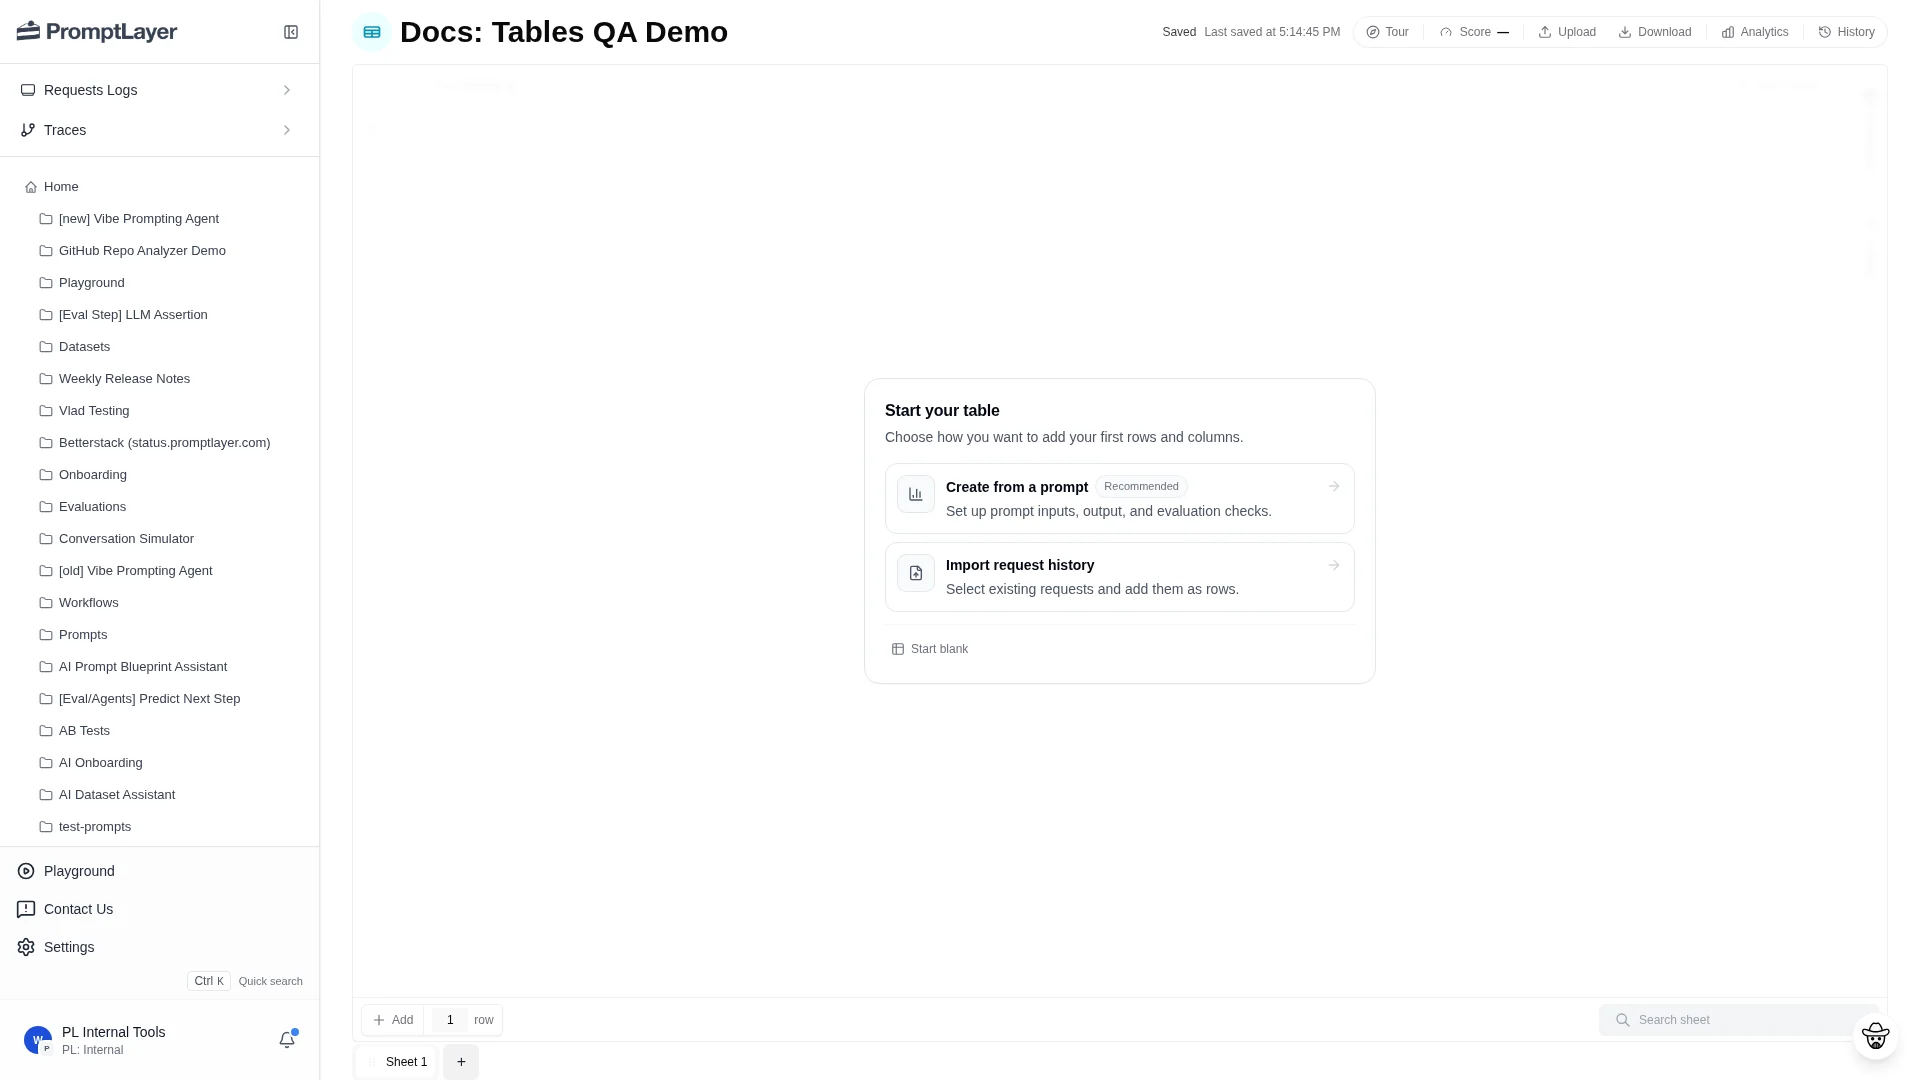 ## Start a Table
A new Table opens with one sheet, one text column, and one row. The empty state gives three starting points:
1. **Create from a prompt**: set up prompt inputs, an output column, and evaluation checks.
2. **Import request history**: select logged requests and add them as rows.
3. **Start blank**: build the sheet manually from rows and columns.
Use **Create from a prompt** when the workflow starts from a Prompt Registry template. Use **Import request history** when production or test traffic is already logged. Use **Start blank** when you want to model the sheet yourself.
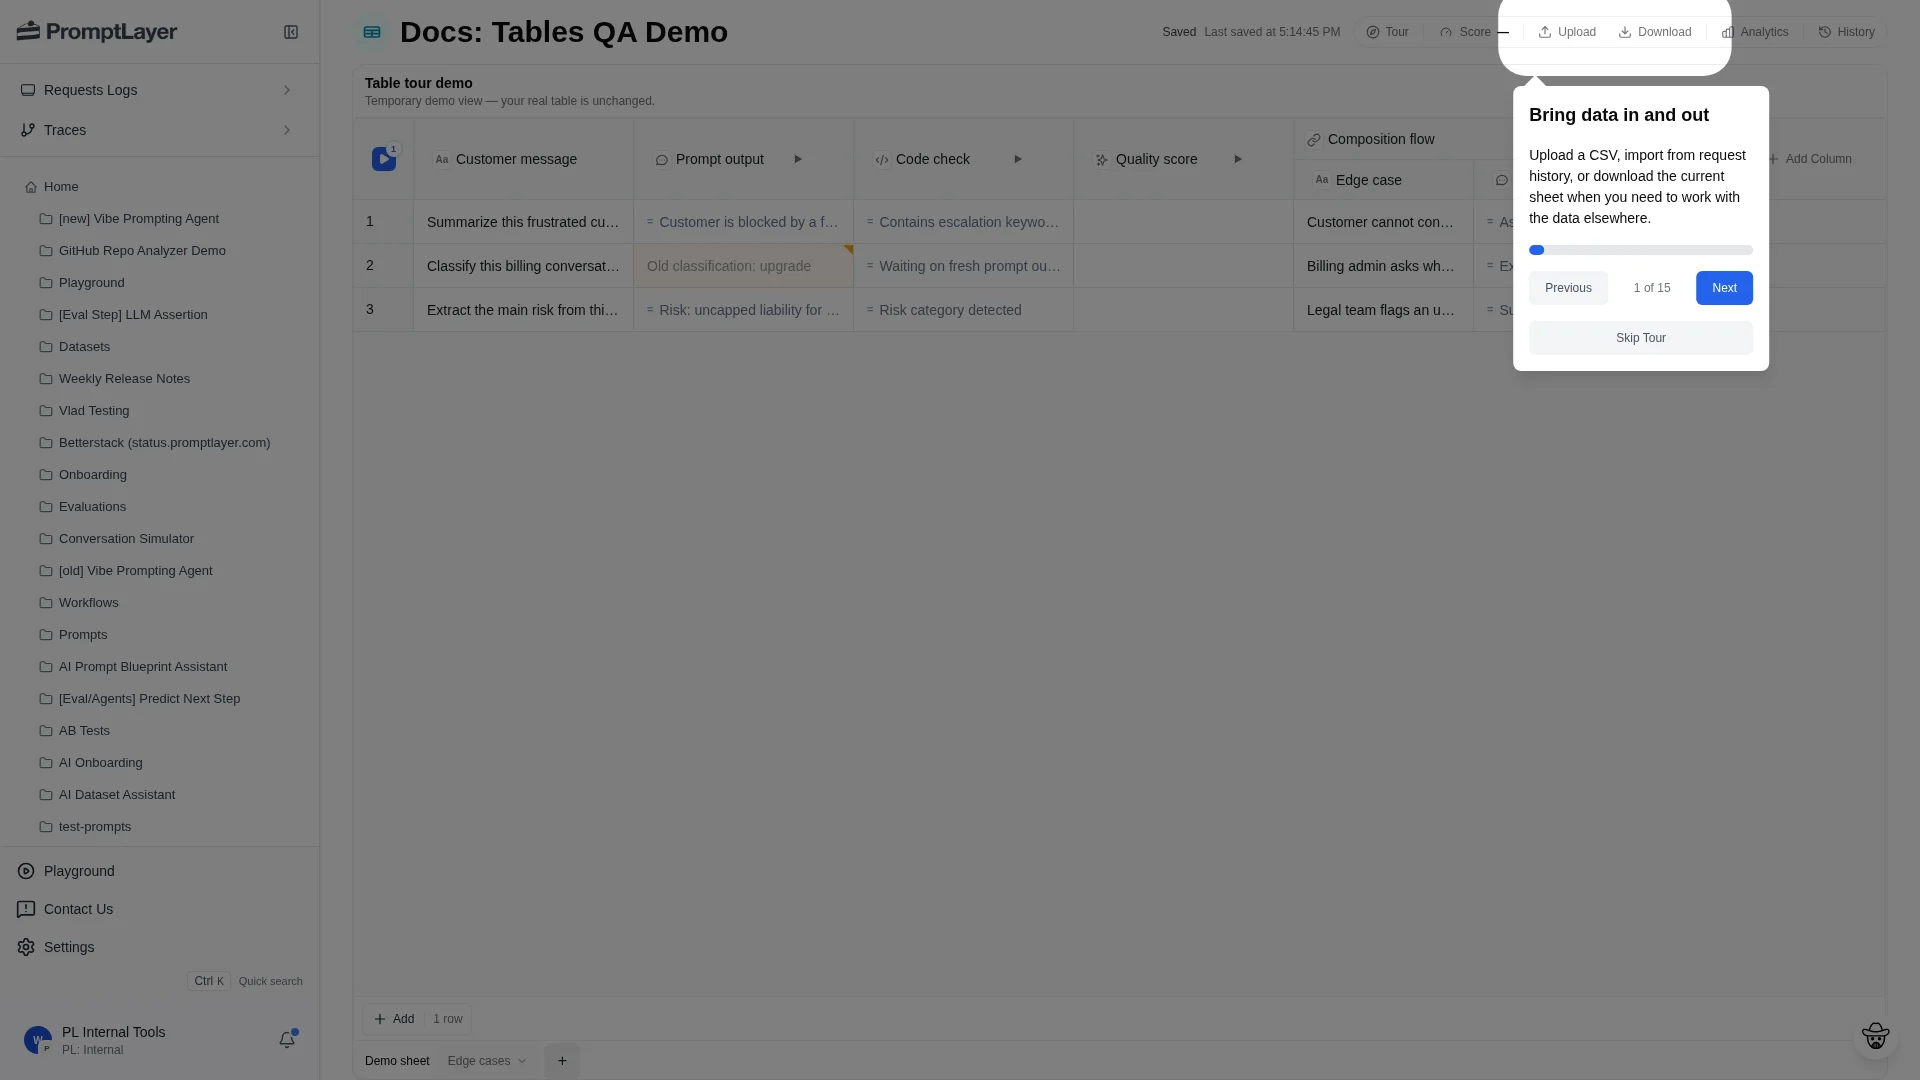
## Main workflow
Most Tables follow a simple loop:
1. Add rows from CSV, request history, or manual entry.
2. Add text columns for inputs, labels, expected answers, or metadata.
3. Add computed columns for prompts, code, assertions, extraction, comparisons, composition, or helper functions.
4. Map computed columns to their sources.
5. Run the sheet, a column, a row, or selected cells.
6. Review cell status, configure scoring, and use history or analytics to compare changes.
## Start a Table
A new Table opens with one sheet, one text column, and one row. The empty state gives three starting points:
1. **Create from a prompt**: set up prompt inputs, an output column, and evaluation checks.
2. **Import request history**: select logged requests and add them as rows.
3. **Start blank**: build the sheet manually from rows and columns.
Use **Create from a prompt** when the workflow starts from a Prompt Registry template. Use **Import request history** when production or test traffic is already logged. Use **Start blank** when you want to model the sheet yourself.
## Main workflow
Most Tables follow a simple loop:
1. Add rows from CSV, request history, or manual entry.
2. Add text columns for inputs, labels, expected answers, or metadata.
3. Add computed columns for prompts, code, assertions, extraction, comparisons, composition, or helper functions.
4. Map computed columns to their sources.
5. Run the sheet, a column, a row, or selected cells.
6. Review cell status, configure scoring, and use history or analytics to compare changes.
 ## Product sections
Import data, manage sheet tabs, add rows, upload CSVs, and import request history.
Add, configure, filter, sort, pin, duplicate, run, and map source columns.
Reference text columns, computed columns, evaluation columns, helper columns, and composition.
Understand cell statuses, stale cells, reruns, selected runs, and cancellation.
Configure score columns, Boolean scoring, numeric scoring, custom code, and winner aggregation.
Review saved versions, score history, diffs, request analytics, and request-level debugging.
## When to use Tables
Use Tables when you need a repeatable workflow over rows of examples: prompt regression tests, request-log replay, dataset creation, model comparisons, multi-step evaluations, human review queues, or batch jobs.
Use legacy Evaluations and Datasets only for existing legacy workflows. For new work, start in Tables.
## API references
Use the Tables API when you want to automate the same actions from code.
Create a Table programmatically.
Add a new sheet to an existing Table.
Add text or computed columns to a sheet.
Queue recalculation work for rows, columns, cells, or stale work.
## Product sections
Import data, manage sheet tabs, add rows, upload CSVs, and import request history.
Add, configure, filter, sort, pin, duplicate, run, and map source columns.
Reference text columns, computed columns, evaluation columns, helper columns, and composition.
Understand cell statuses, stale cells, reruns, selected runs, and cancellation.
Configure score columns, Boolean scoring, numeric scoring, custom code, and winner aggregation.
Review saved versions, score history, diffs, request analytics, and request-level debugging.
## When to use Tables
Use Tables when you need a repeatable workflow over rows of examples: prompt regression tests, request-log replay, dataset creation, model comparisons, multi-step evaluations, human review queues, or batch jobs.
Use legacy Evaluations and Datasets only for existing legacy workflows. For new work, start in Tables.
## API references
Use the Tables API when you want to automate the same actions from code.
Create a Table programmatically.
Add a new sheet to an existing Table.
Add text or computed columns to a sheet.
Queue recalculation work for rows, columns, cells, or stale work.