> ## Documentation Index
> Fetch the complete documentation index at: https://docs.promptlayer.com/llms.txt
> Use this file to discover all available pages before exploring further.
# Analytics
> Turn a filtered set of request logs or traces into usage, performance, cost, and quality charts.
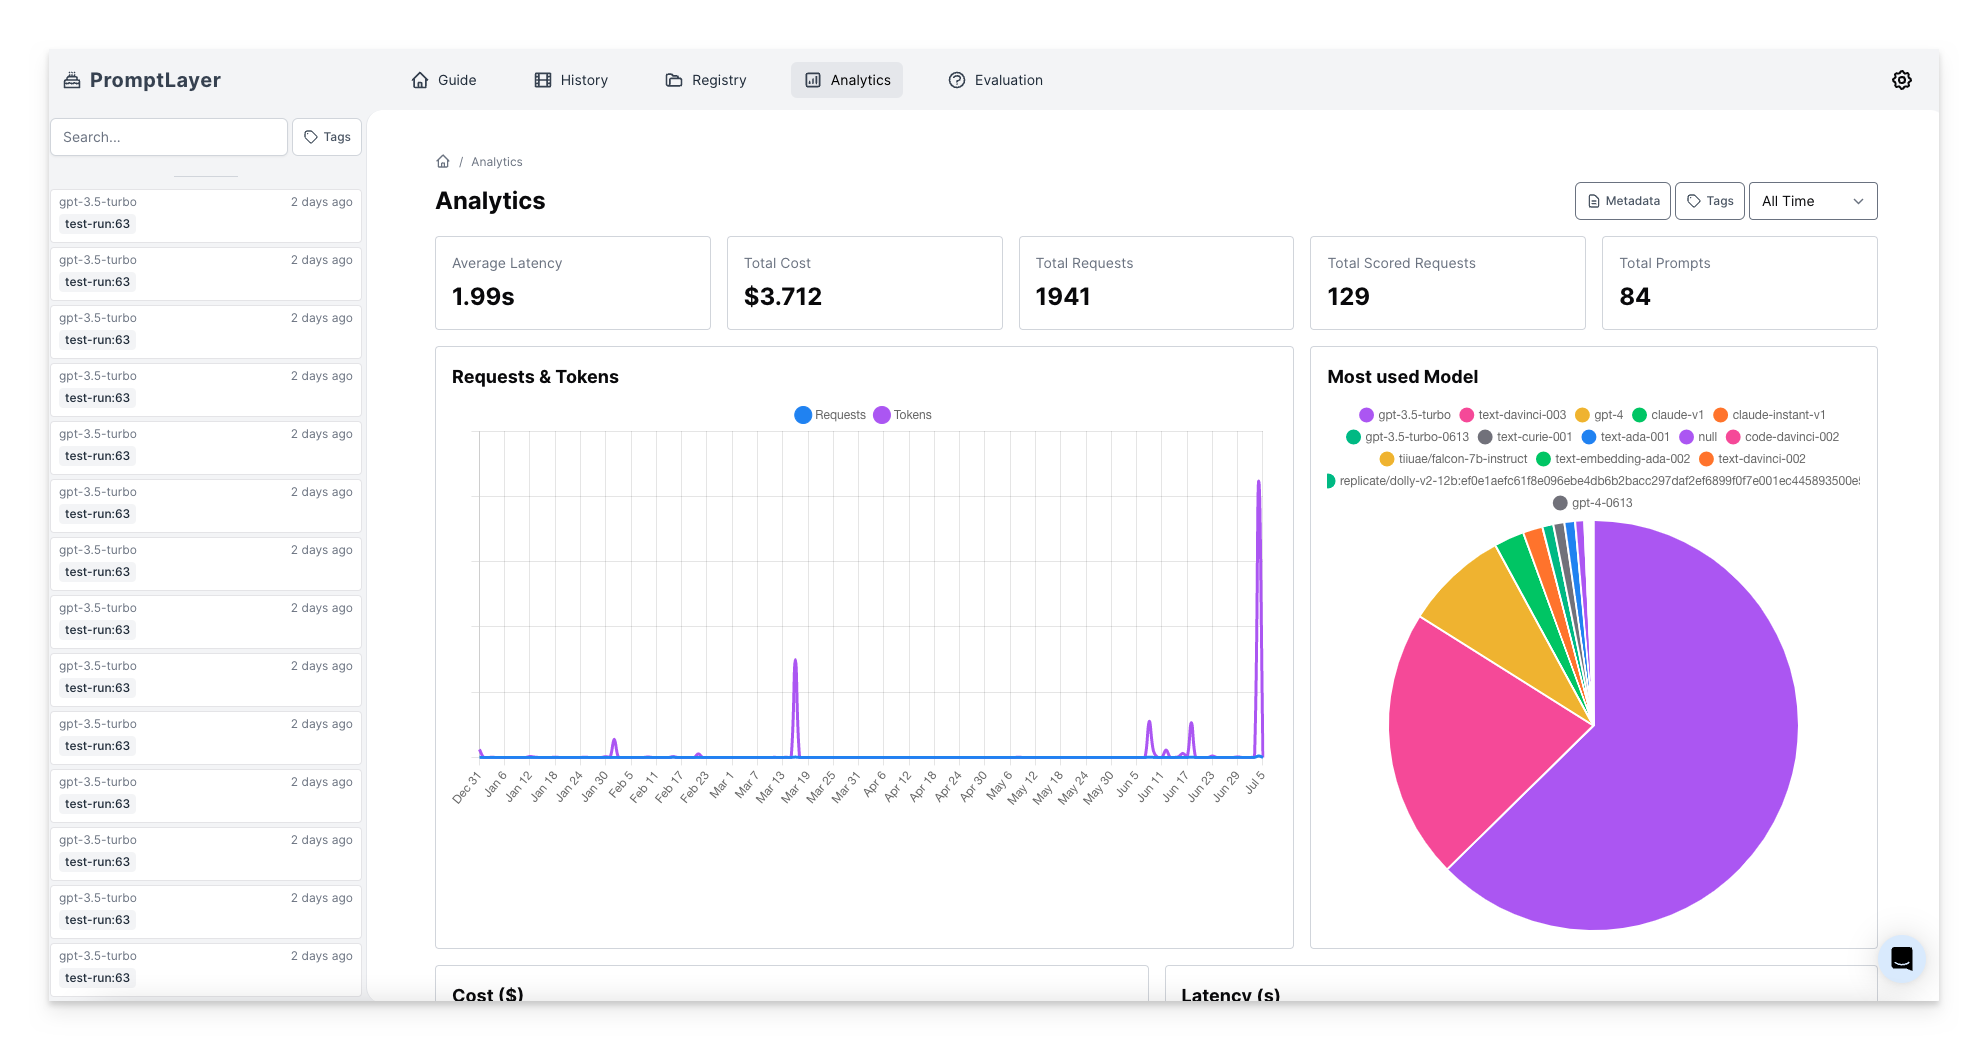
Analytics turns the current [Search](/features/search-and-analytics/search) query into charts. Use it to move from an individual [request log](/features/observability/request-logs) or [trace](/features/observability/traces) to trends in usage, performance, cost, errors, and application behavior.
 ## Open Analytics
1. Open [**Request Logs**](/features/observability/request-logs) or [**Traces**](/features/observability/traces) in the PromptLayer sidebar.
2. Set the date range and add any free-text or structured filters.
3. Switch from the Requests or Traces tab to **Analytics**.
4. Select **Run query** after changing the analytics query.
The table and Analytics tab use the same query. You can narrow the data first and then chart only the matching request logs or traces.
## Request Analytics
Request analytics includes views for:
* Latency, request volume, tokens, and cost over time
* Requests by model, prompt, and status
* Response format, cached tokens, and reasoning tokens
* Provider, prompt, tag, and metadata cost breakdowns
* Common errors, metadata keys, output keys, and tools
Use metadata and tags to compare environments, customers, application versions, or other segments that matter to your application.
## Trace Analytics
Trace analytics includes views for:
* End-to-end latency, including average, p50, p90, and p95
* Trace volume and status over time
* Models and tools used across traces
* Prompt templates and workflows used across traces
* Trace- and span-level filters
## Interact with Charts
Many charts can update the current query. Depending on the chart, select a point, bar, or segment to add a filter, or drag across a time-series chart to narrow the date range. Use **Undo** to restore the previous analytics query.
## Ask for an Analysis
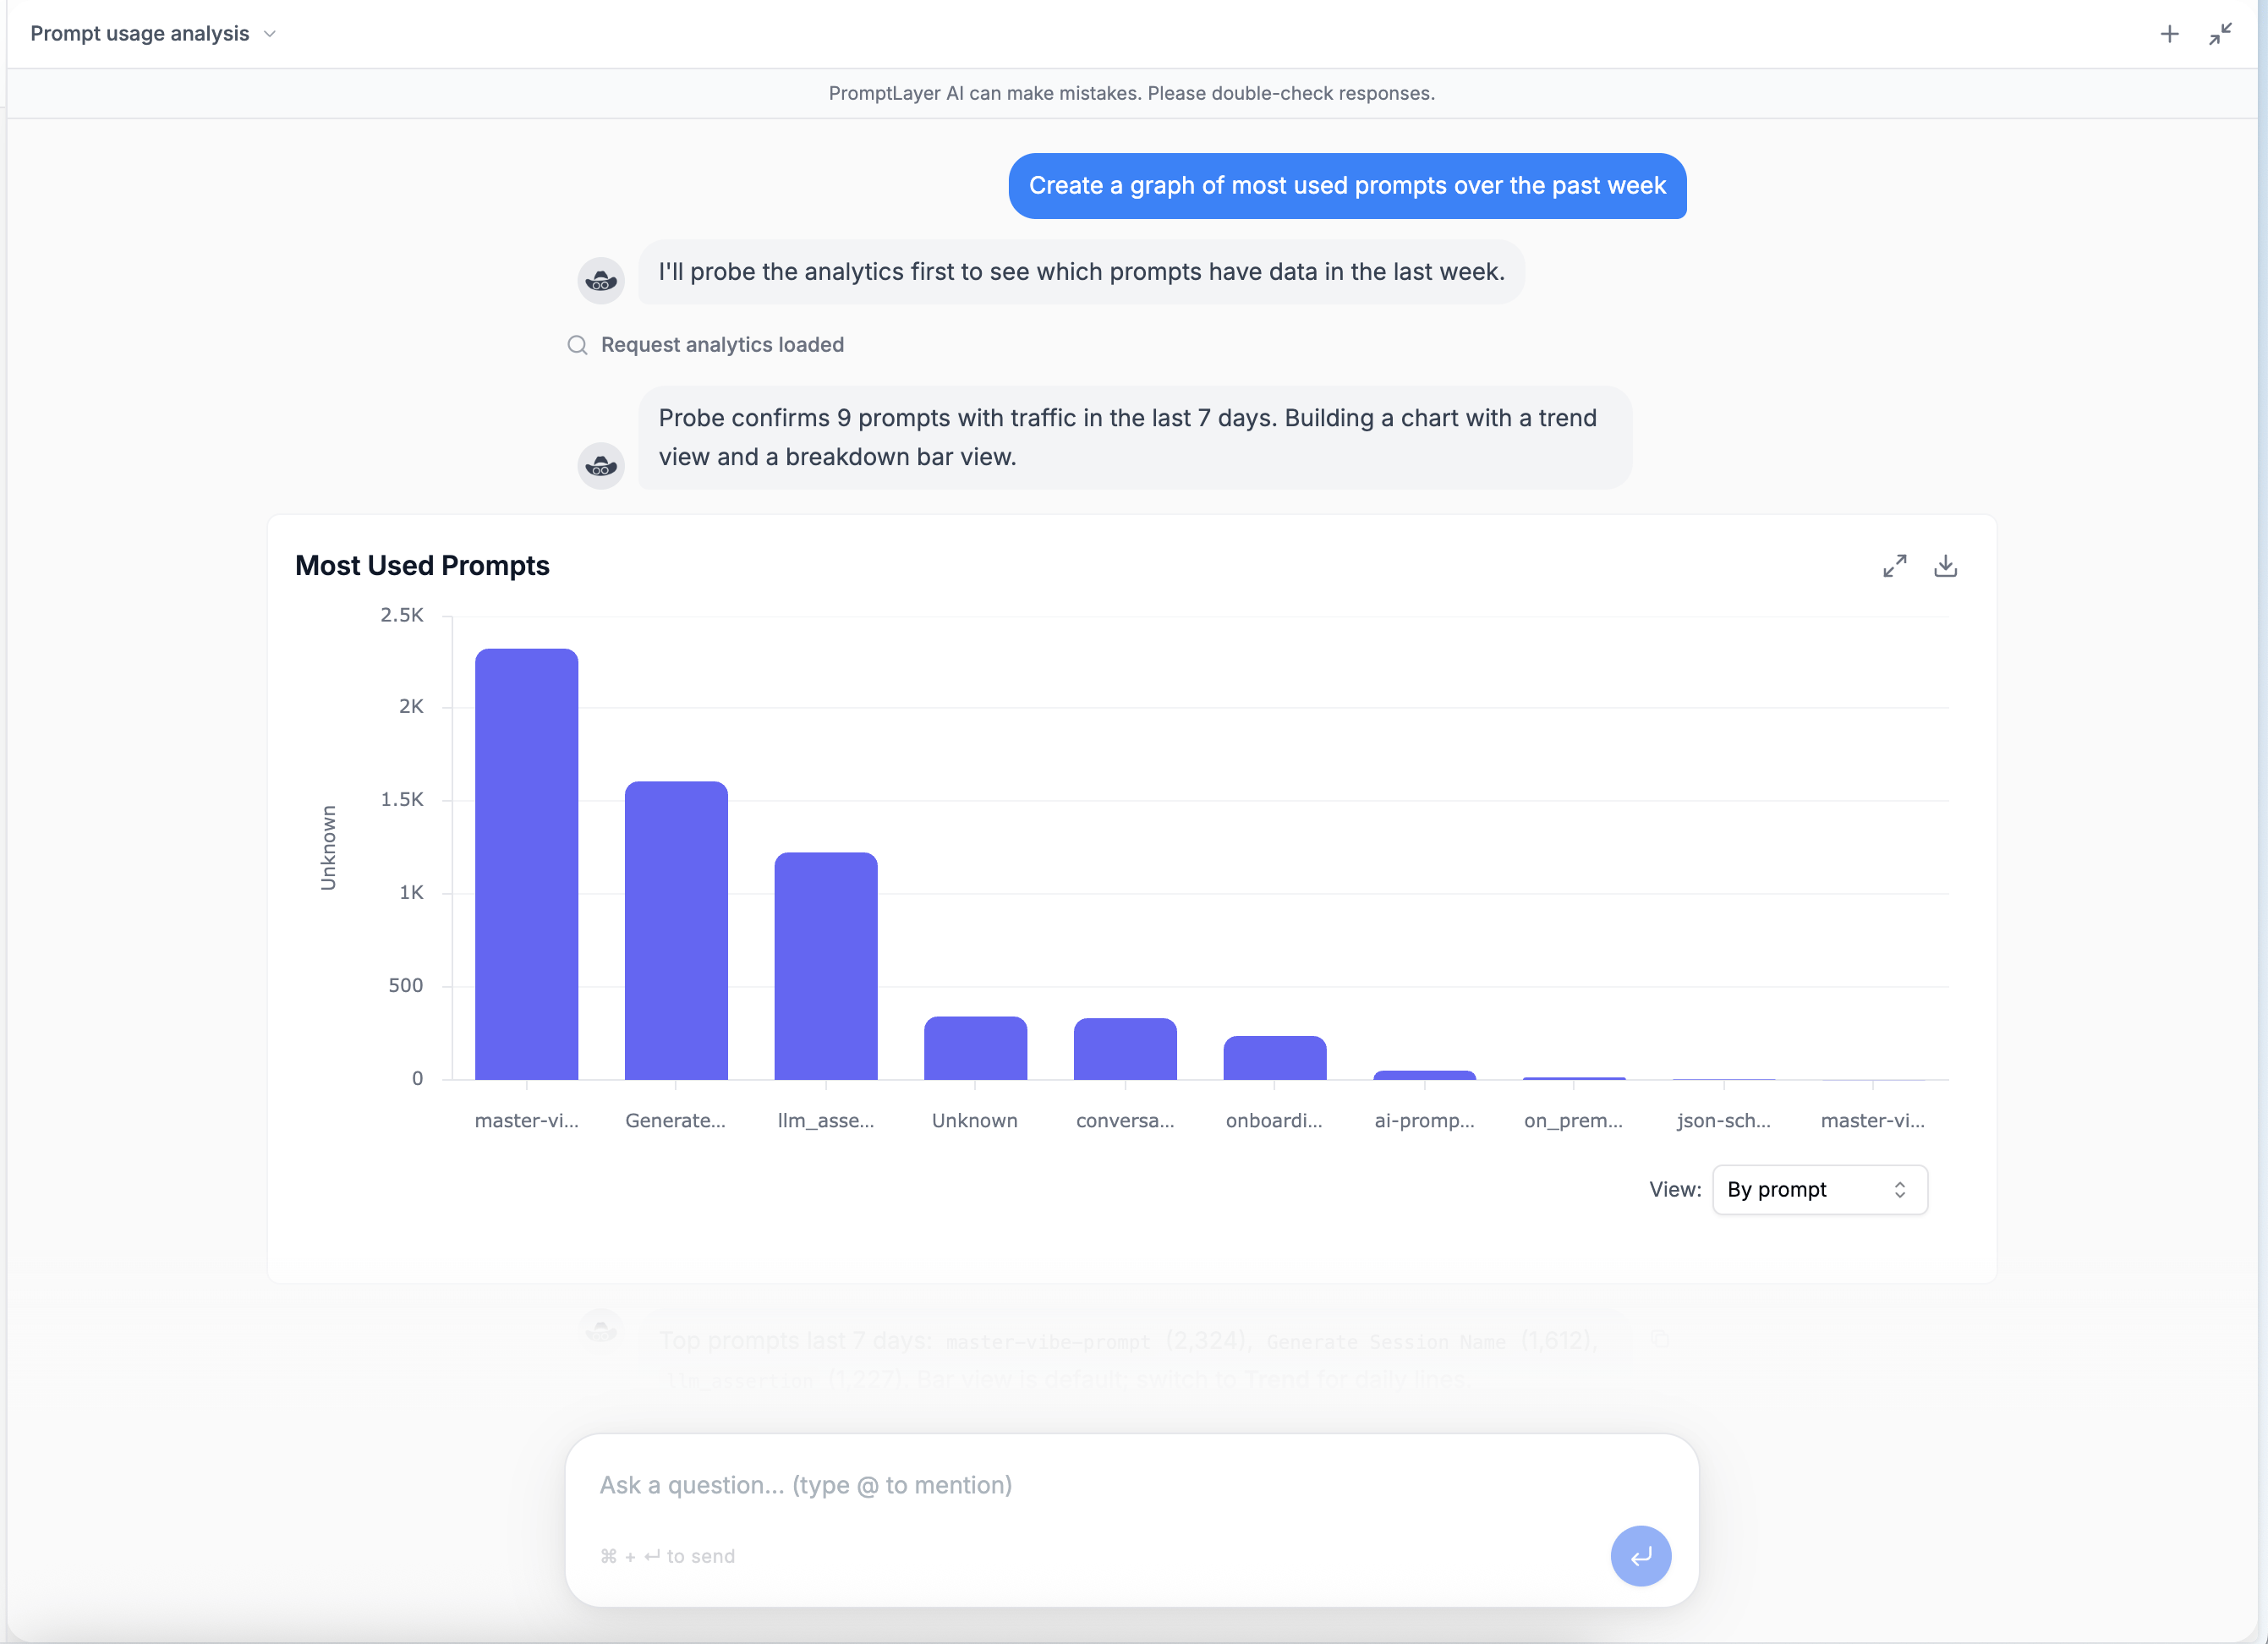
Open the PromptLayer assistant and ask a question such as, "Create a graph of the most used prompts over the past week." It can inspect request or trace analytics and create a chart from the relevant data.
## Open Analytics
1. Open [**Request Logs**](/features/observability/request-logs) or [**Traces**](/features/observability/traces) in the PromptLayer sidebar.
2. Set the date range and add any free-text or structured filters.
3. Switch from the Requests or Traces tab to **Analytics**.
4. Select **Run query** after changing the analytics query.
The table and Analytics tab use the same query. You can narrow the data first and then chart only the matching request logs or traces.
## Request Analytics
Request analytics includes views for:
* Latency, request volume, tokens, and cost over time
* Requests by model, prompt, and status
* Response format, cached tokens, and reasoning tokens
* Provider, prompt, tag, and metadata cost breakdowns
* Common errors, metadata keys, output keys, and tools
Use metadata and tags to compare environments, customers, application versions, or other segments that matter to your application.
## Trace Analytics
Trace analytics includes views for:
* End-to-end latency, including average, p50, p90, and p95
* Trace volume and status over time
* Models and tools used across traces
* Prompt templates and workflows used across traces
* Trace- and span-level filters
## Interact with Charts
Many charts can update the current query. Depending on the chart, select a point, bar, or segment to add a filter, or drag across a time-series chart to narrow the date range. Use **Undo** to restore the previous analytics query.
## Ask for an Analysis
Open the PromptLayer assistant and ask a question such as, "Create a graph of the most used prompts over the past week." It can inspect request or trace analytics and create a chart from the relevant data.
 Analytics is unavailable when the selected search range includes data from before your workspace's OpenSearch cutover date. See [Search Older Data](/features/search-and-analytics/search#search-older-data).
## Use Analytics through the API
* [Request Analytics](/reference/request-analytics)
* [Request Analytics - Custom Queries](/reference/request-analytics-custom-analytics)
* [Trace Analytics - Custom Queries](/reference/trace-analytics-custom-analytics)
Analytics is unavailable when the selected search range includes data from before your workspace's OpenSearch cutover date. See [Search Older Data](/features/search-and-analytics/search#search-older-data).
## Use Analytics through the API
* [Request Analytics](/reference/request-analytics)
* [Request Analytics - Custom Queries](/reference/request-analytics-custom-analytics)
* [Trace Analytics - Custom Queries](/reference/trace-analytics-custom-analytics)