> ## Documentation Index
> Fetch the complete documentation index at: https://docs.promptlayer.com/llms.txt
> Use this file to discover all available pages before exploring further.
# Overview
> Use Observability to analyze app behavior, review PromptLayer usage, and turn useful history into datasets.
Observability helps you understand how your AI applications behave in production, testing, and development. Use it to optimize behavior, inspect workflows, and track cost and latency.
It also shows how your team uses PromptLayer: which users, workspaces, and applications are active over time.
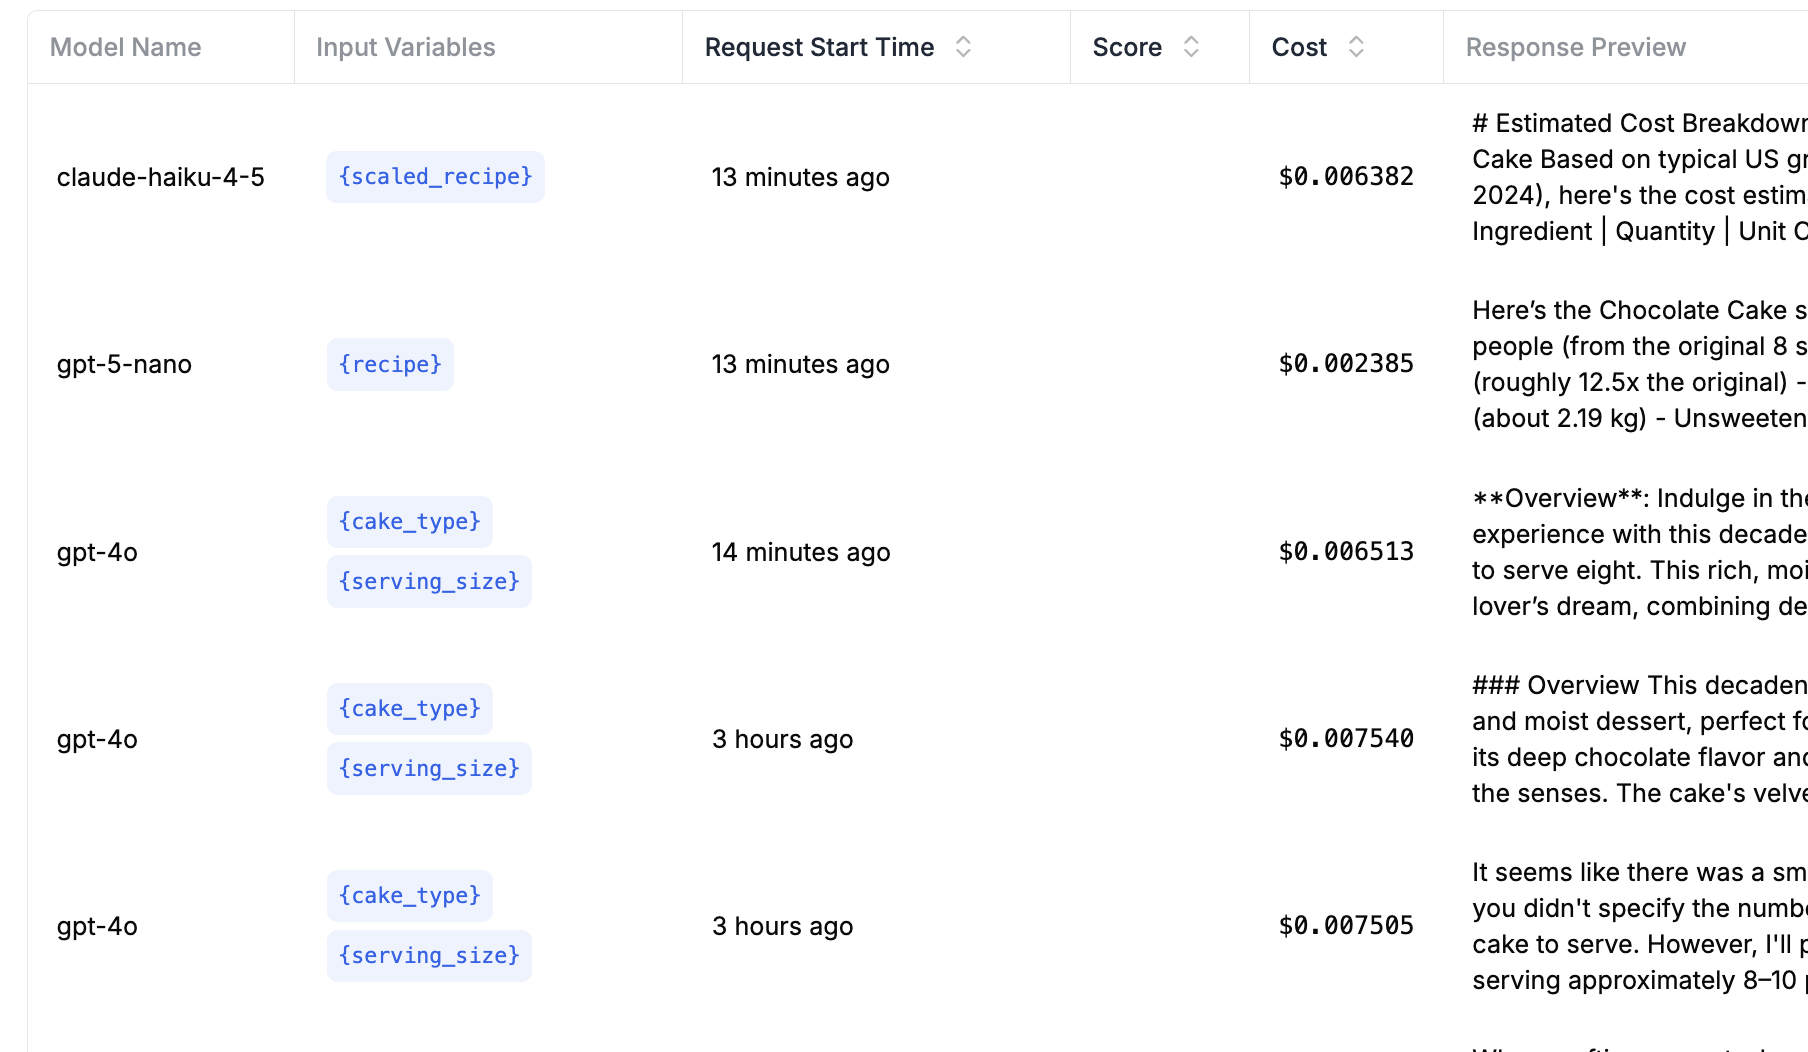
**Request logs** and **traces** are the core artifacts. Request logs capture model calls, inputs, outputs, timing, tokens, cost, status, tags, metadata, scores, and prompt associations. Traces show span-level context for workflows, agents, tools, and multi-step logic. You can use both to create datasets for evaluations, backtests, and automation.
## What you can do
* Analyze application behavior with request logs and traces (spans, inputs, outputs, latency, cost, token usage, and more)
* Turn requests and traces into datasets for evaluations and regression tests.
* Review usage across workspaces, users, and environments.
## How it fits together
1. Log requests and traces with the PromptLayer SDK, REST API, custom logging, or OpenTelemetry.
2. Add metadata, tags, scores, and prompt associations so you can find the right runs later.
3. Use logs, traces, and analytics to understand application behavior across prompts, users, sessions, models, workflows, and environments.
4. Use the same data to understand how your team uses PromptLayer.
5. Convert useful history into datasets for evaluations and automated feedback loops.
## Viewing logs
Click **Logs** in the sidebar to see request history. You can filter by prompt, search by content, inspect errors, and review request details.
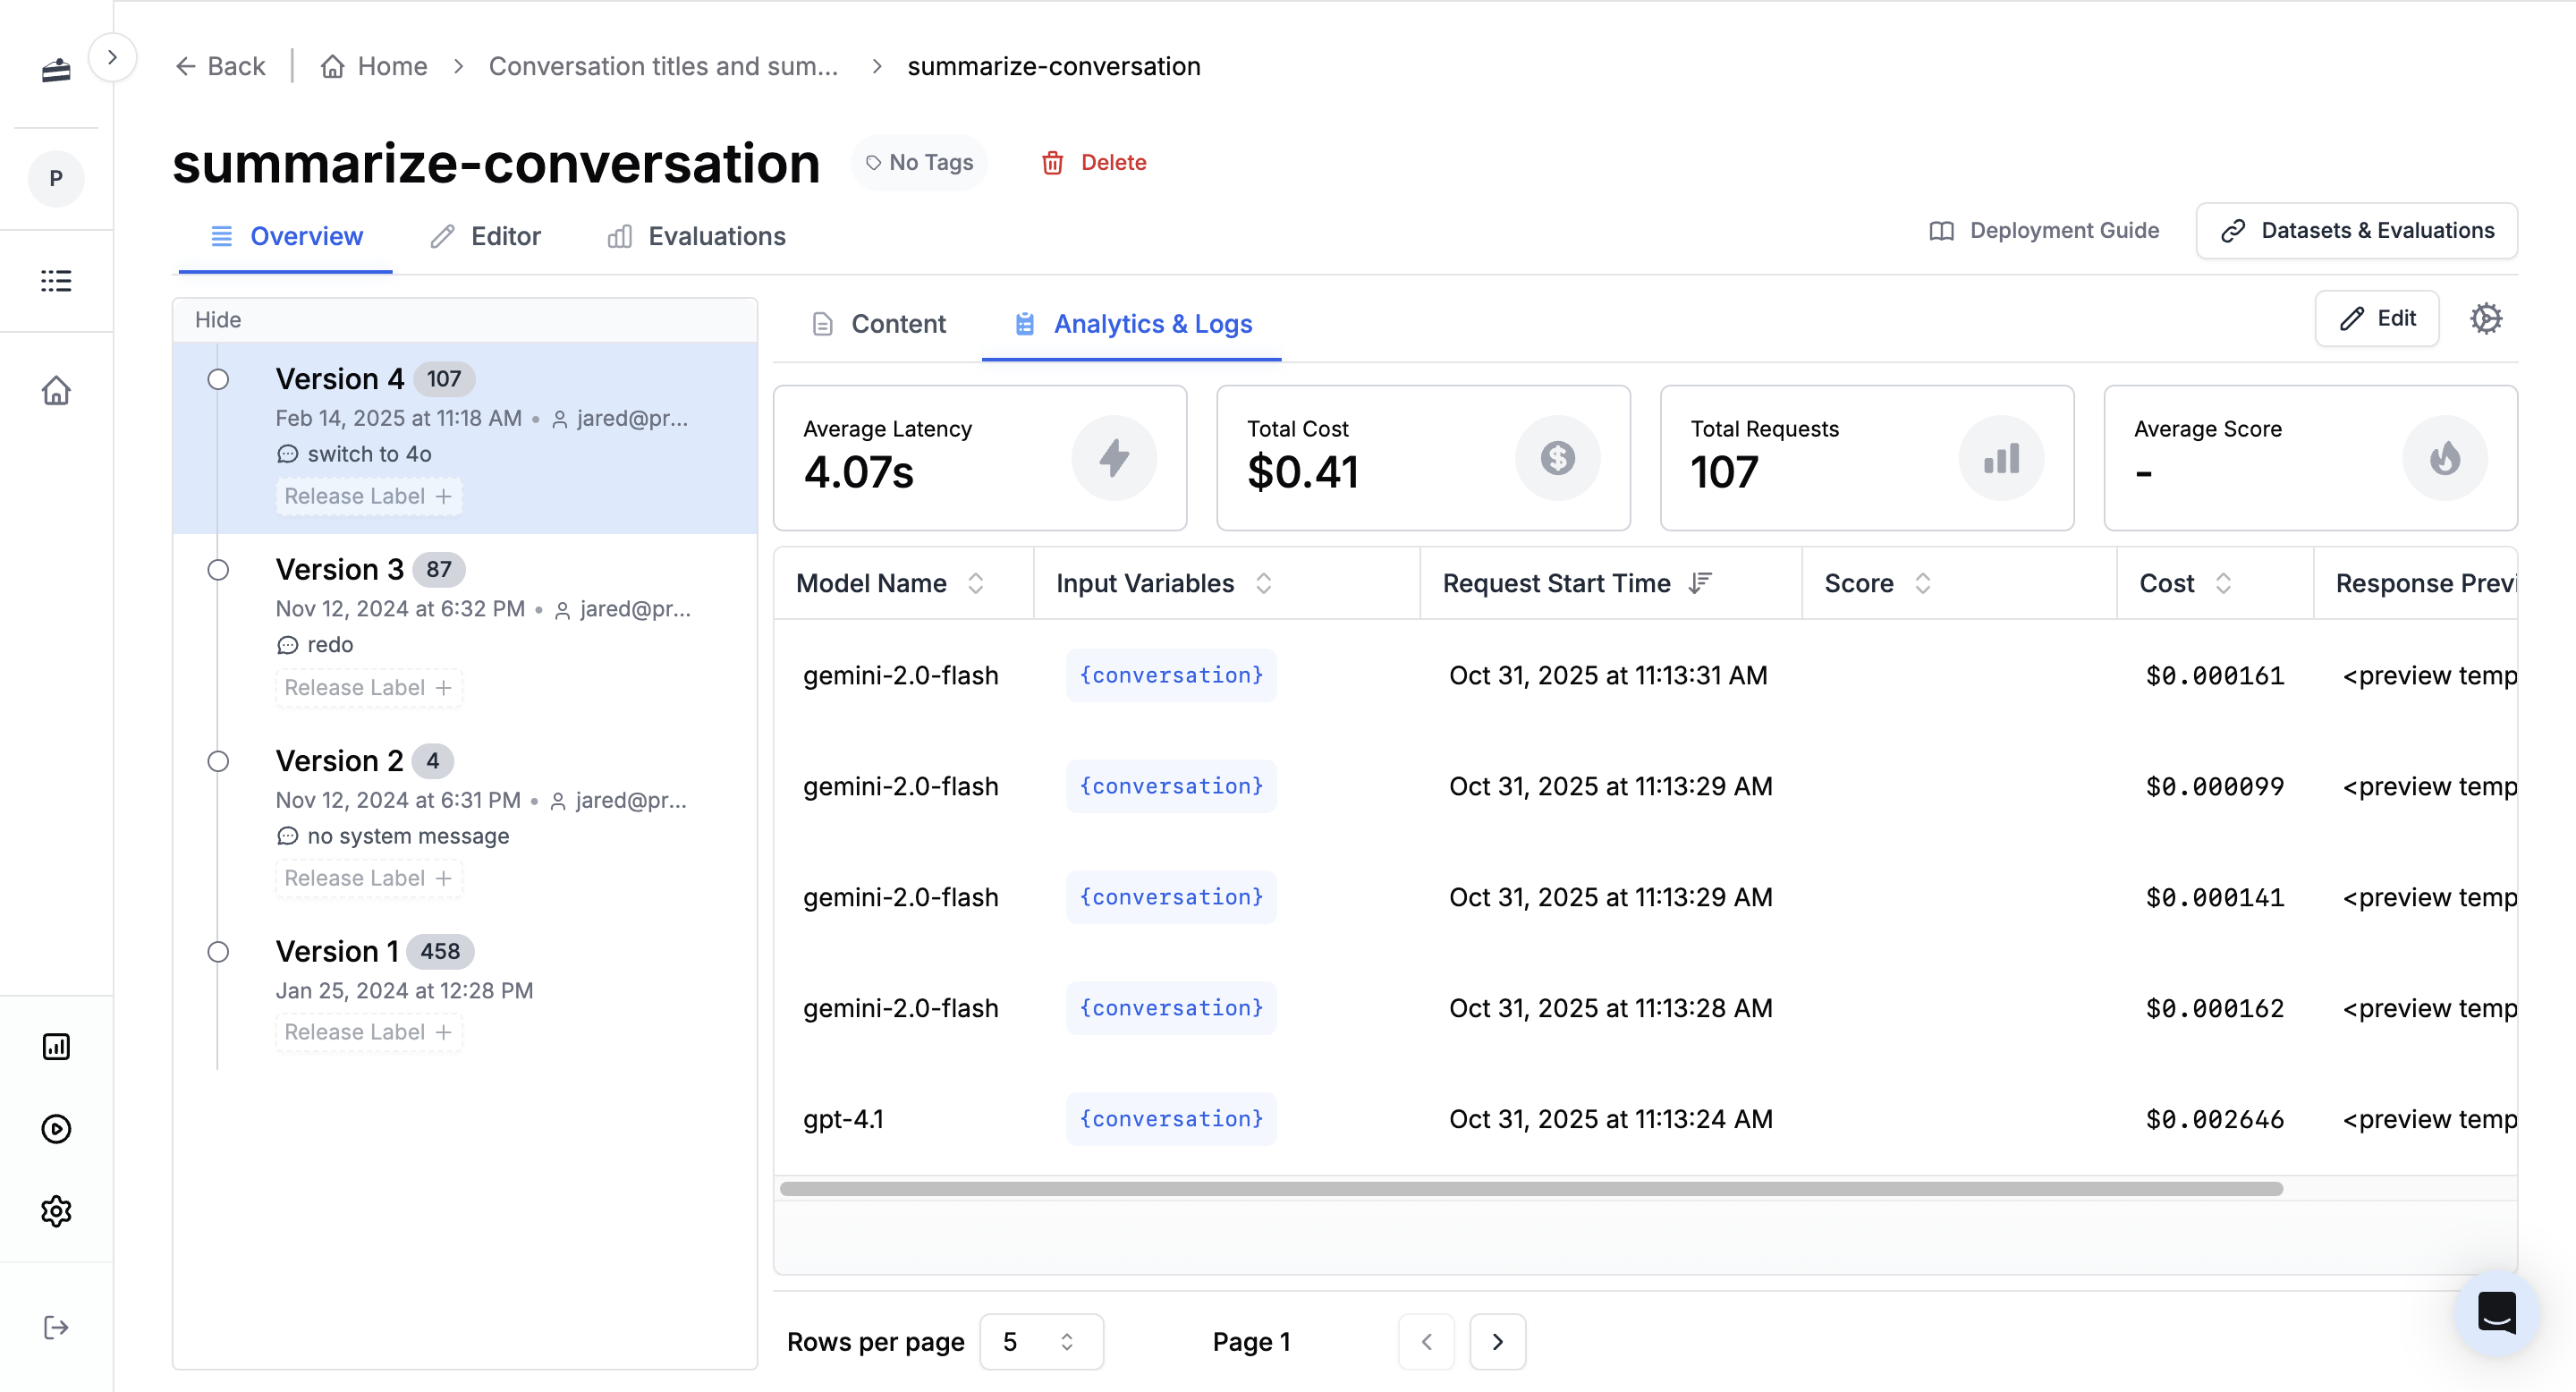
 You can also view logs for a specific prompt by clicking **Analytics & Logs** in the prompt editor.
 From the logs table, select historical requests and add them to a dataset when you want to backtest a prompt change.
## Next steps
Track cost, latency, request volume, token usage, models, prompts, tags, and metadata.
Inspect span hierarchies, timing, inputs, outputs, errors, and linked request logs.
Find logs by request content, metadata, tags, scores, status, model, prompt, and usage fields.
Build evaluation and backtesting Tables from filtered request history and production examples.
Add request IDs, metadata, tags, scores, prompt associations, and custom logs from code.
From the logs table, select historical requests and add them to a dataset when you want to backtest a prompt change.
## Next steps
Track cost, latency, request volume, token usage, models, prompts, tags, and metadata.
Inspect span hierarchies, timing, inputs, outputs, errors, and linked request logs.
Find logs by request content, metadata, tags, scores, status, model, prompt, and usage fields.
Build evaluation and backtesting Tables from filtered request history and production examples.
Add request IDs, metadata, tags, scores, prompt associations, and custom logs from code.